
Real-time visibility into sugar juice quality
Zutora helps sugar factories monitor juice quality continuously by combining inline measurements such as Brix, color, turbidity and temperature into one practical process monitoring system. This gives operators earlier insight into process changes and supports better control of purification, evaporation and downstream crystallization.
Juice quality changes continuously — laboratory data often arrives too late.
Sugar juice quality can change quickly due to raw material variation, extraction conditions, clarification performance, evaporation stability and process upsets. Laboratory analysis remains essential, but it usually provides only periodic snapshots.
For process operation, delayed information can make it difficult to detect trends early, compare process areas, or understand how upstream changes affect evaporation and crystallization.
Inline juice quality monitoring helps bridge the gap between laboratory measurements and real-time process control.
Challenges
Delayed quality feedback
Laboratory values are valuable, but they may arrive after the process condition has already changed.
Limited visibility between process areas
Operators may not clearly see how juice quality changes from raw juice to clarified juice, thin juice or thick juice.
Changing raw material and process conditions
Beet and cane quality, clarification performance and process loading can vary continuously.
Downstream impact
Juice quality affects evaporation, crystallization, product color, energy use and overall factory stability.
What can be monitored inline
Brix / concentration
Inline refractometers provide continuous concentration measurement in juice and syrup streams. Brix trends help operators understand dilution, evaporation performance and process stability.
Color
Photometric measurement can monitor juice color continuously, helping factories follow purification performance, color removal and quality trends between laboratory checks.
Turbidity
Turbidity or optical absorption measurements can indicate suspended solids, clarification performance, filtration issues or process disturbances.
Temperature
Temperature compensation is essential for reliable interpretation of concentration and optical measurements.
Optional calculated values
Depending on the measurement setup, inline data can be used to create compensated trends, quality indicators, alarms and process KPIs.
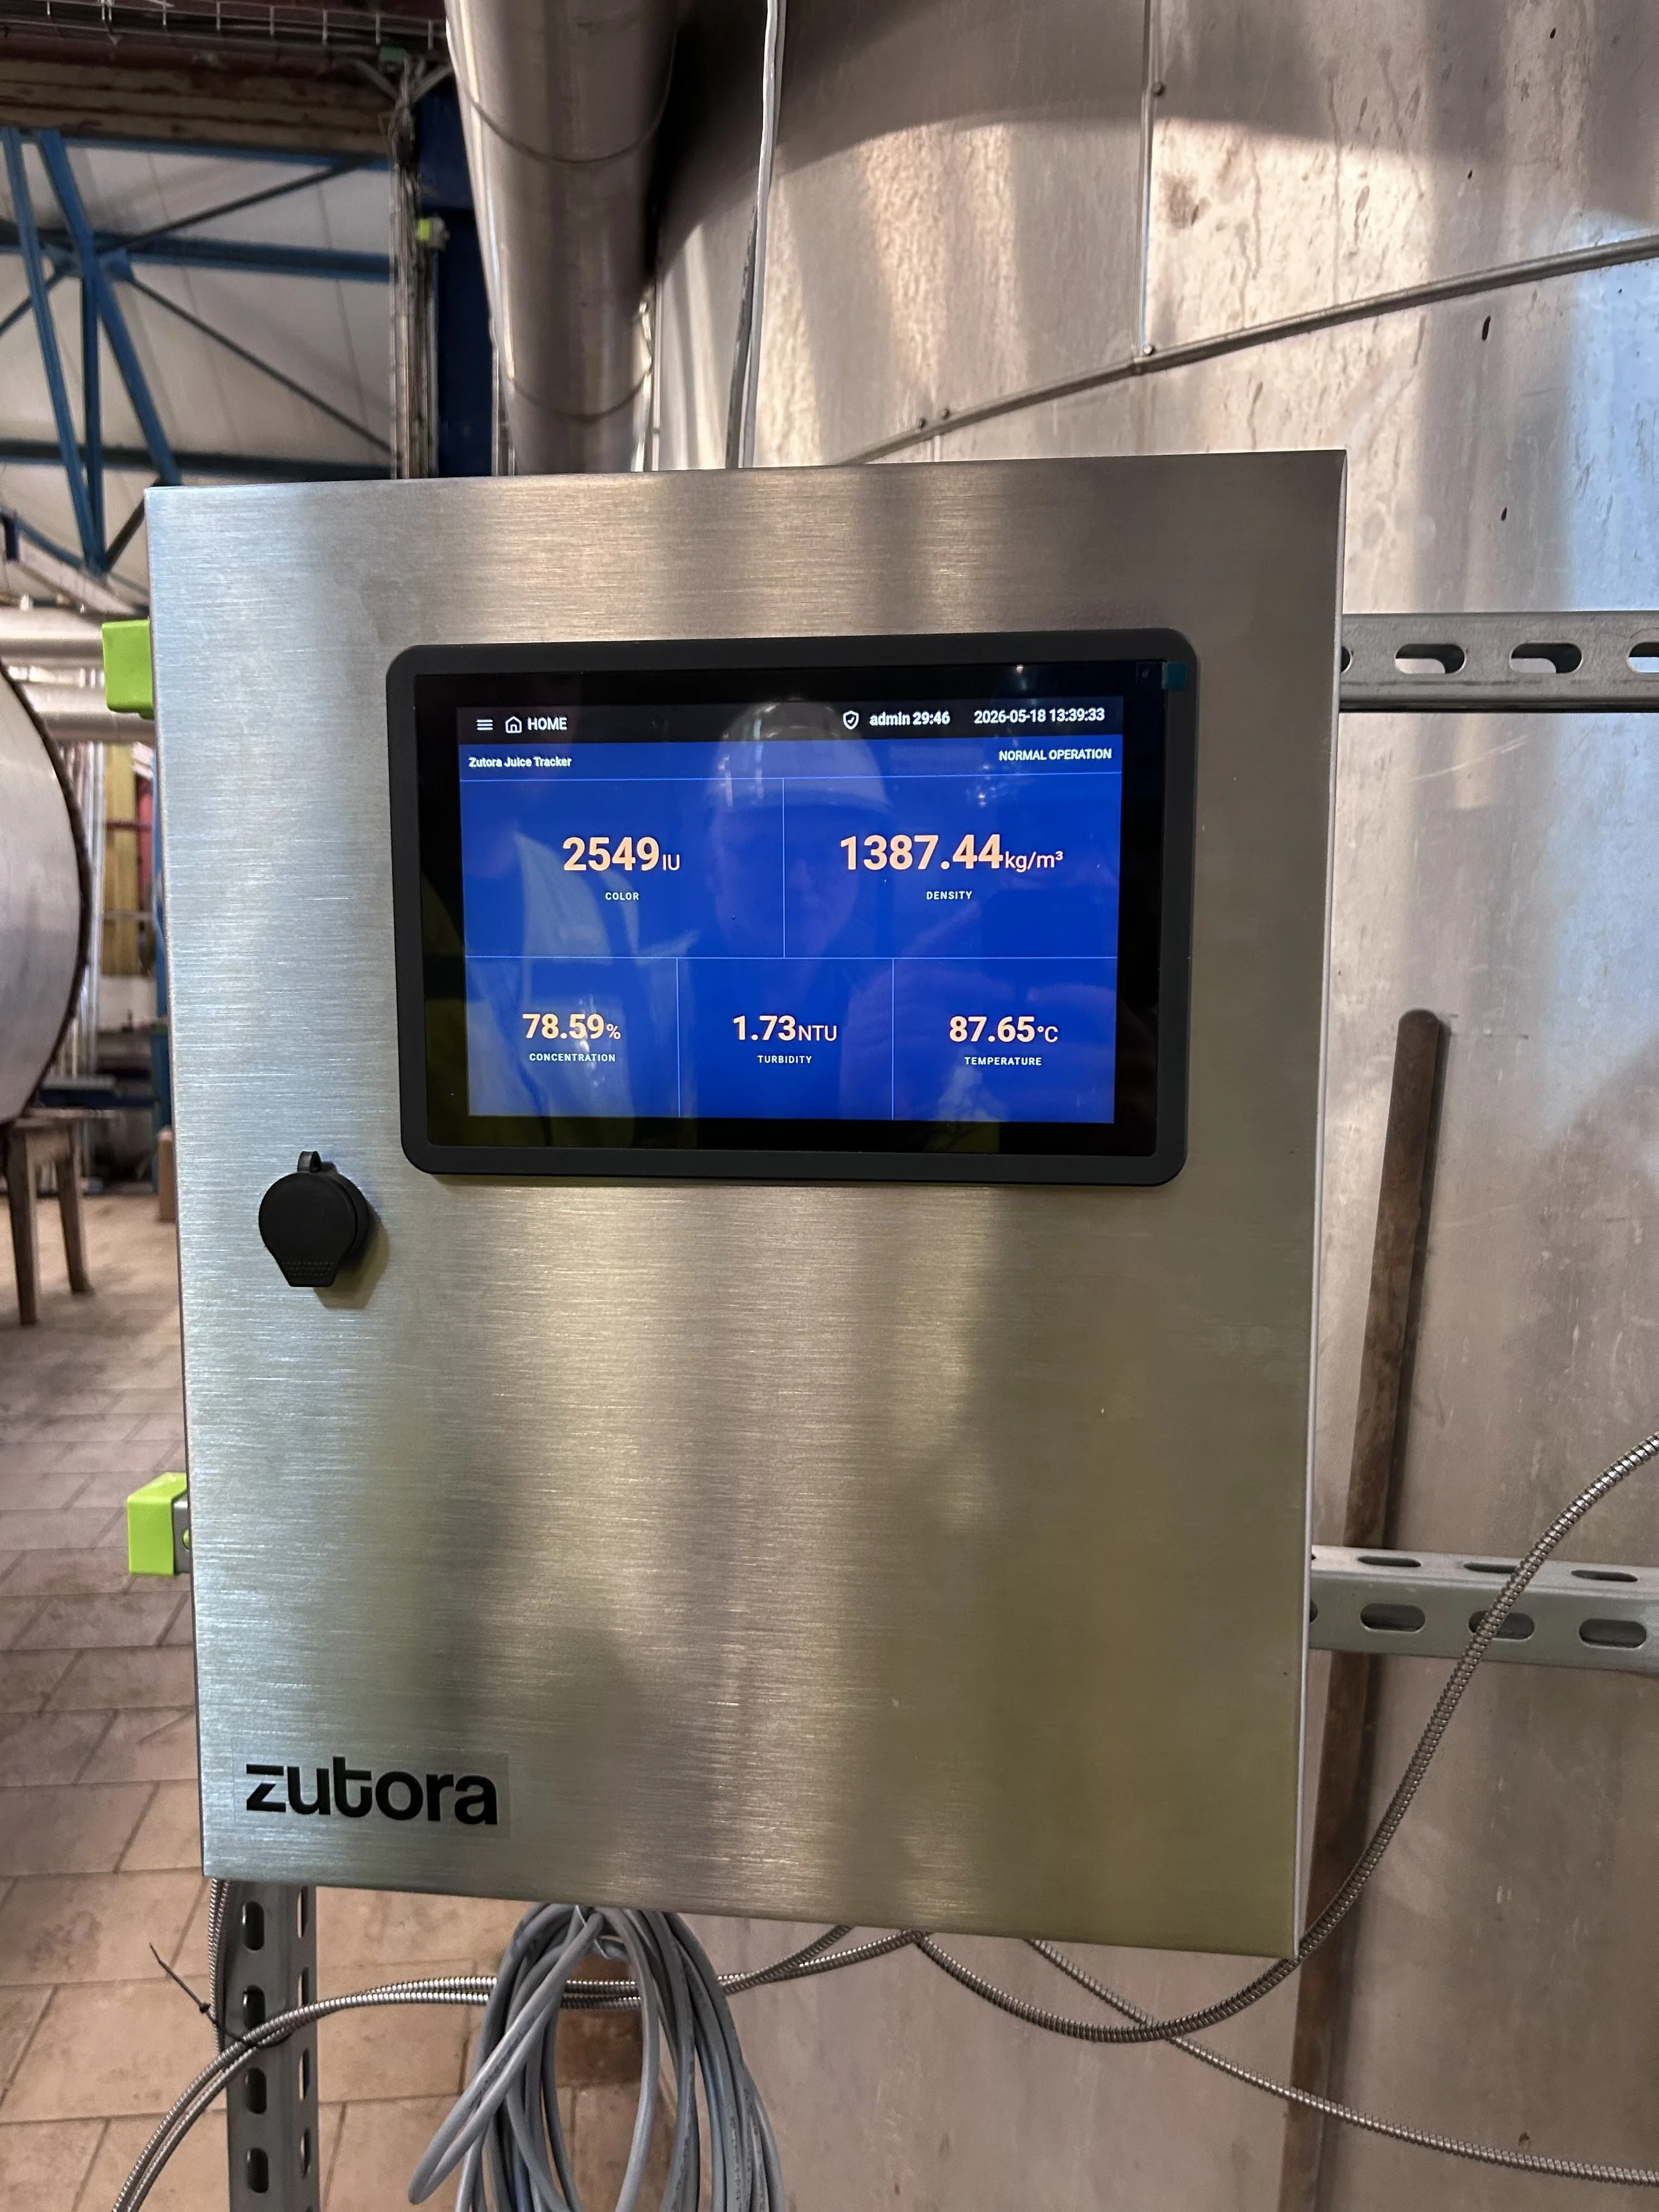
JuiceTracker — continuous juice quality monitoring
JuiceTracker is Zutora’s solution for real-time monitoring of sugar juice quality. It combines inline analyzers, application-specific calculations and a clear operator interface to show how juice quality changes over time.
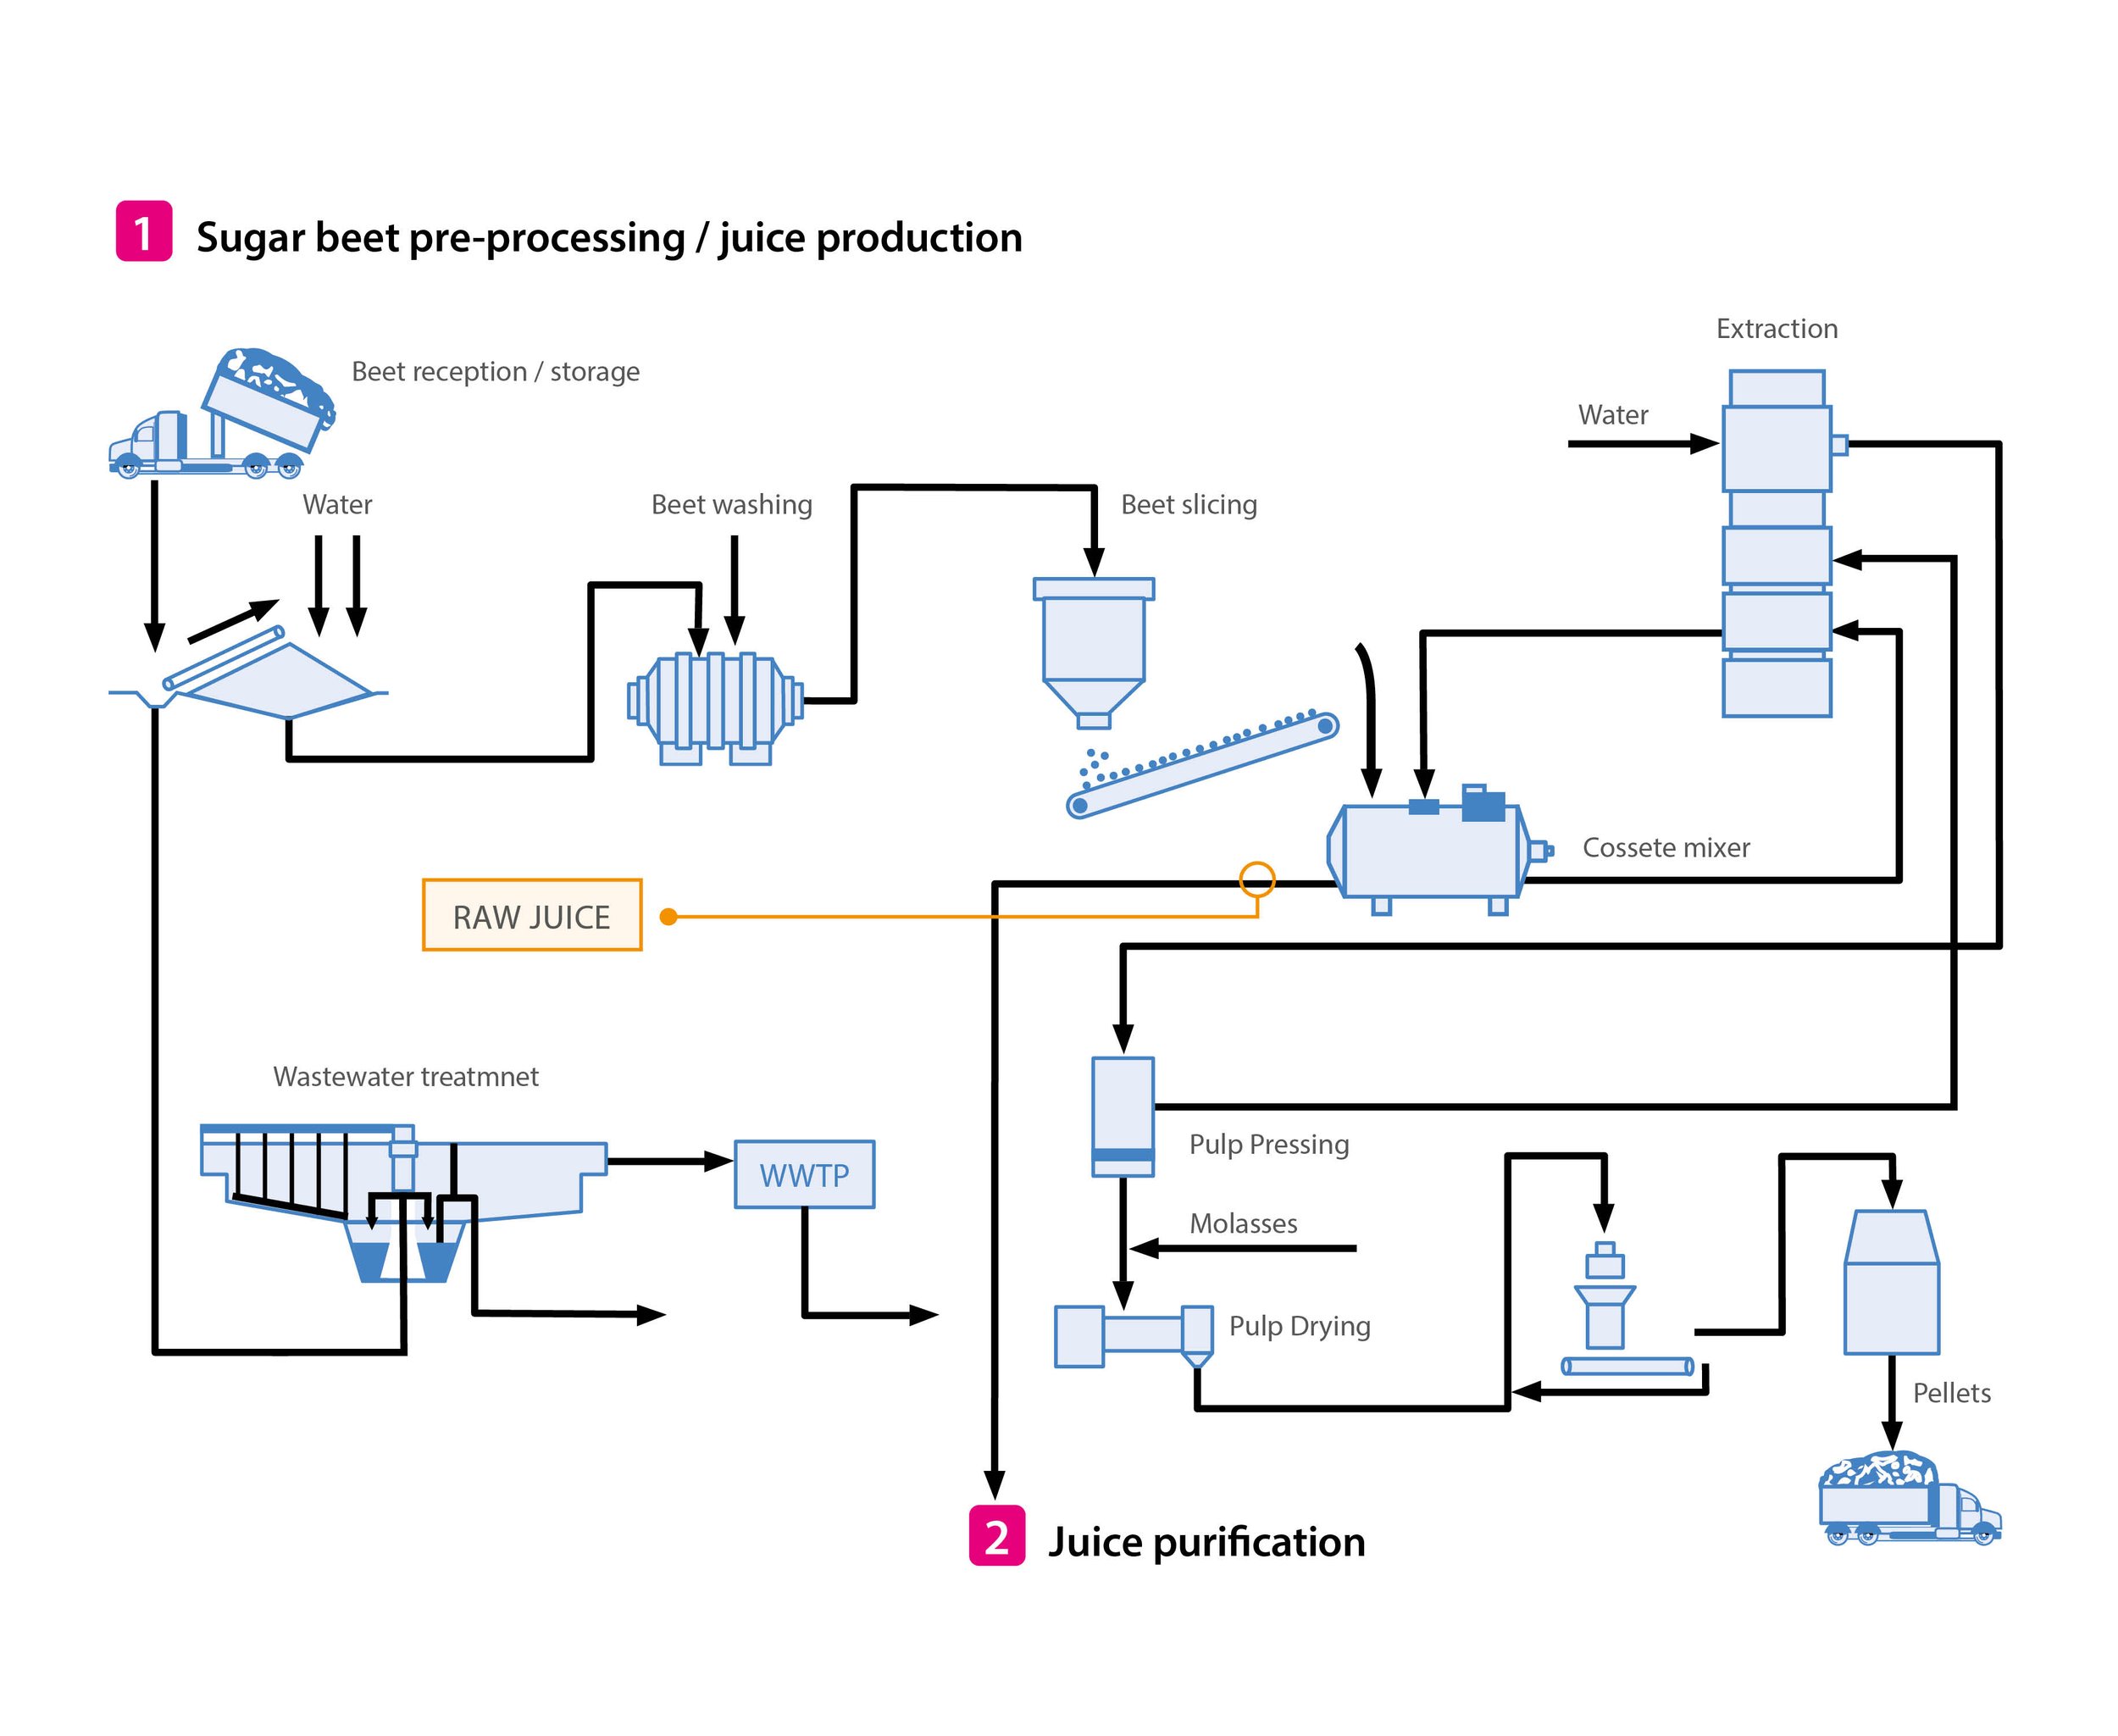
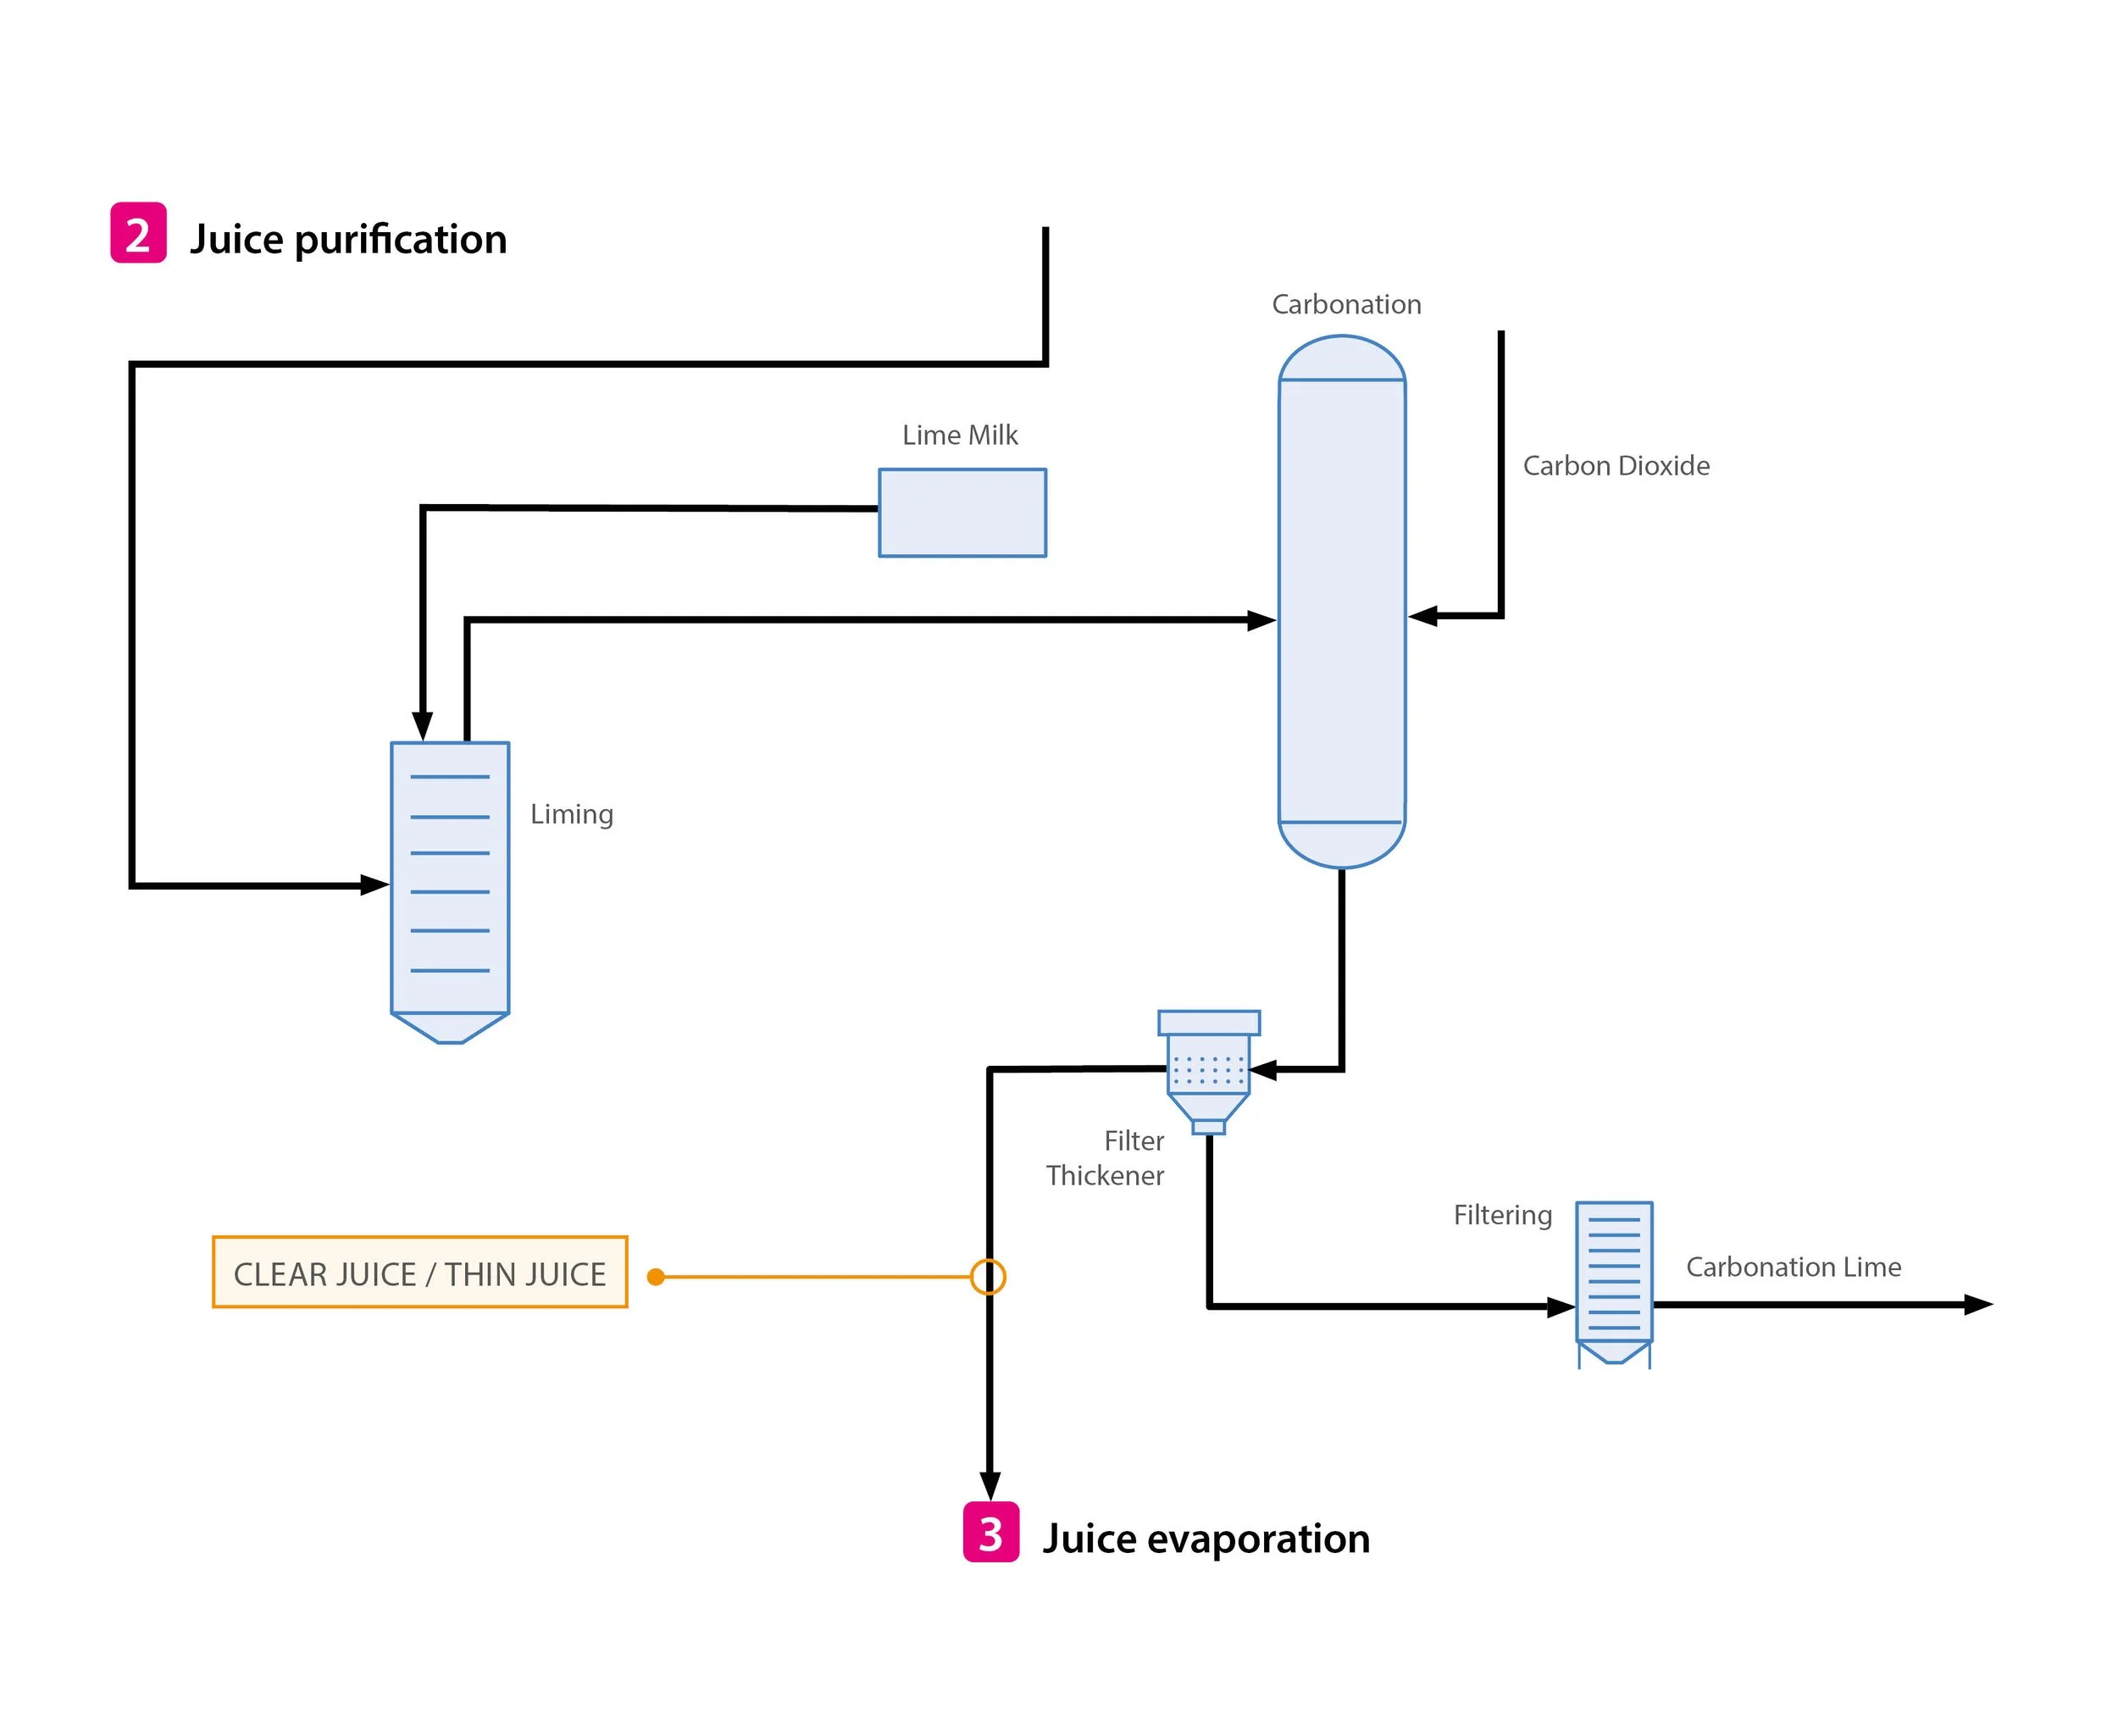
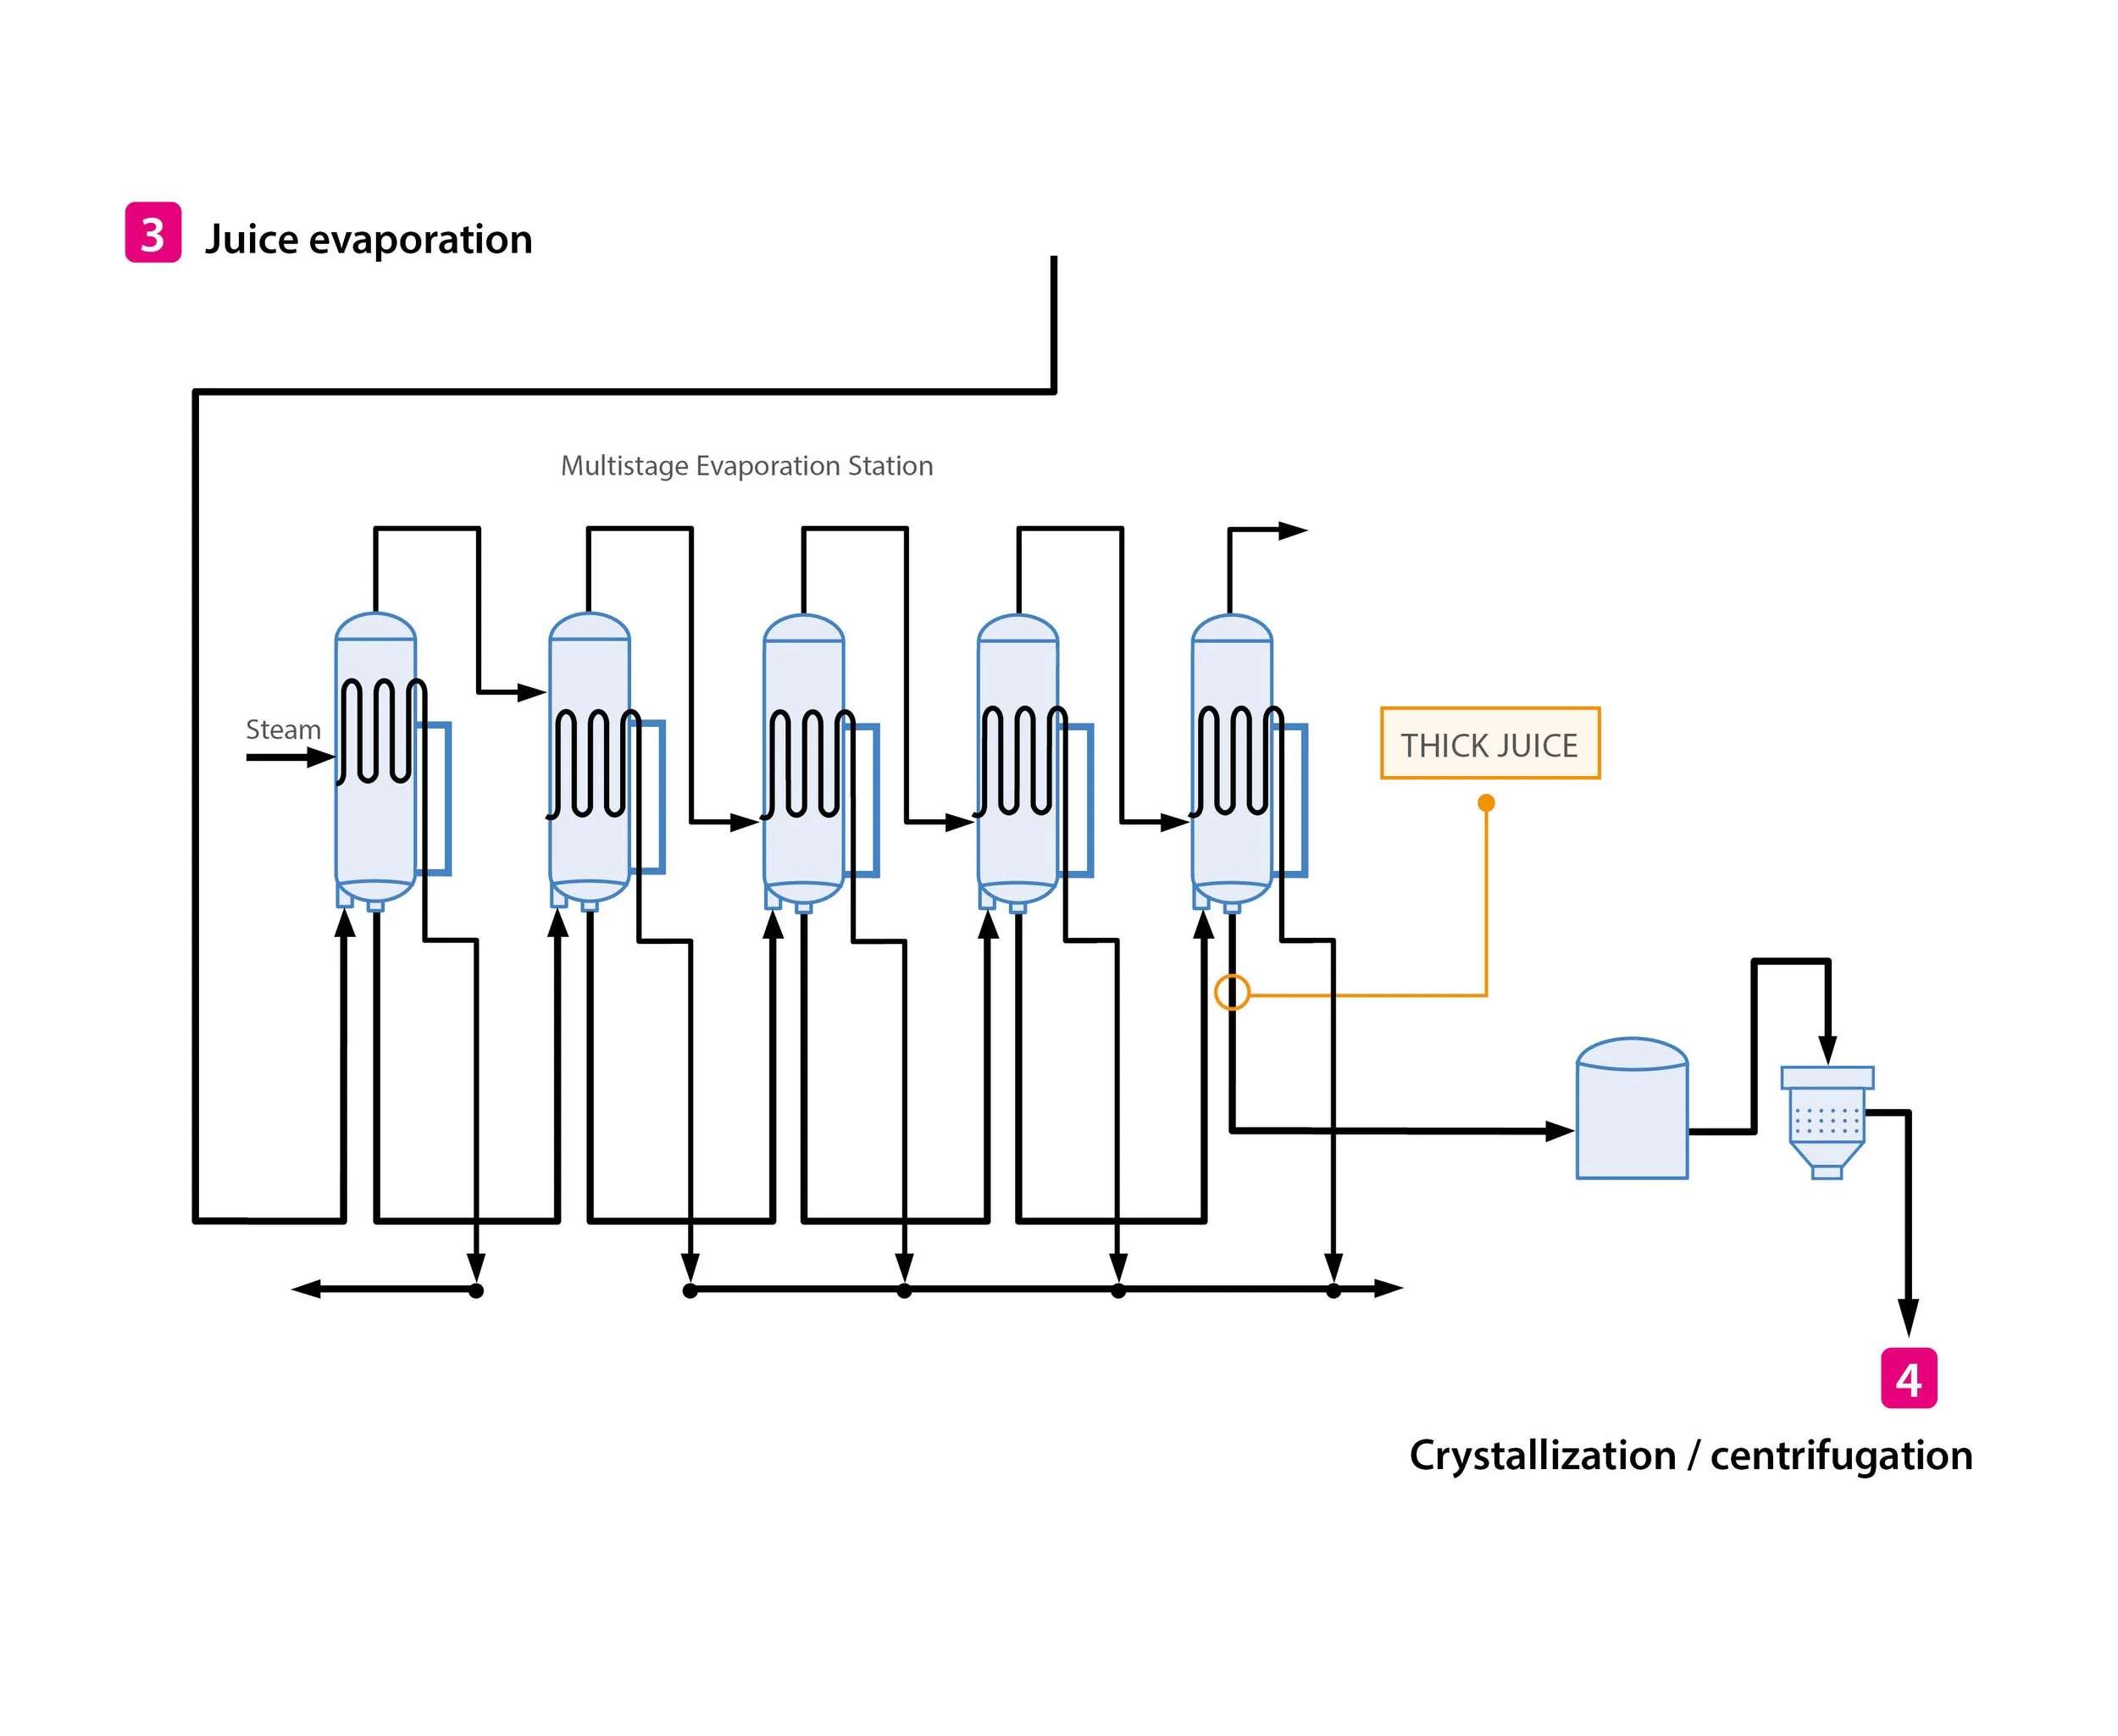
The system can be configured for different factory layouts and measurement points, such as raw juice, clarified juice, thin juice, thick juice or other process streams.
Core capabilities:
Inline Brix / concentration measurement
Inline color measurement
Inline turbidity or absorption measurement
Temperature compensation
Real-time trends
Alarms and quality indicators
Data logging and export
Optional integration with factory automation systems
Where to measure
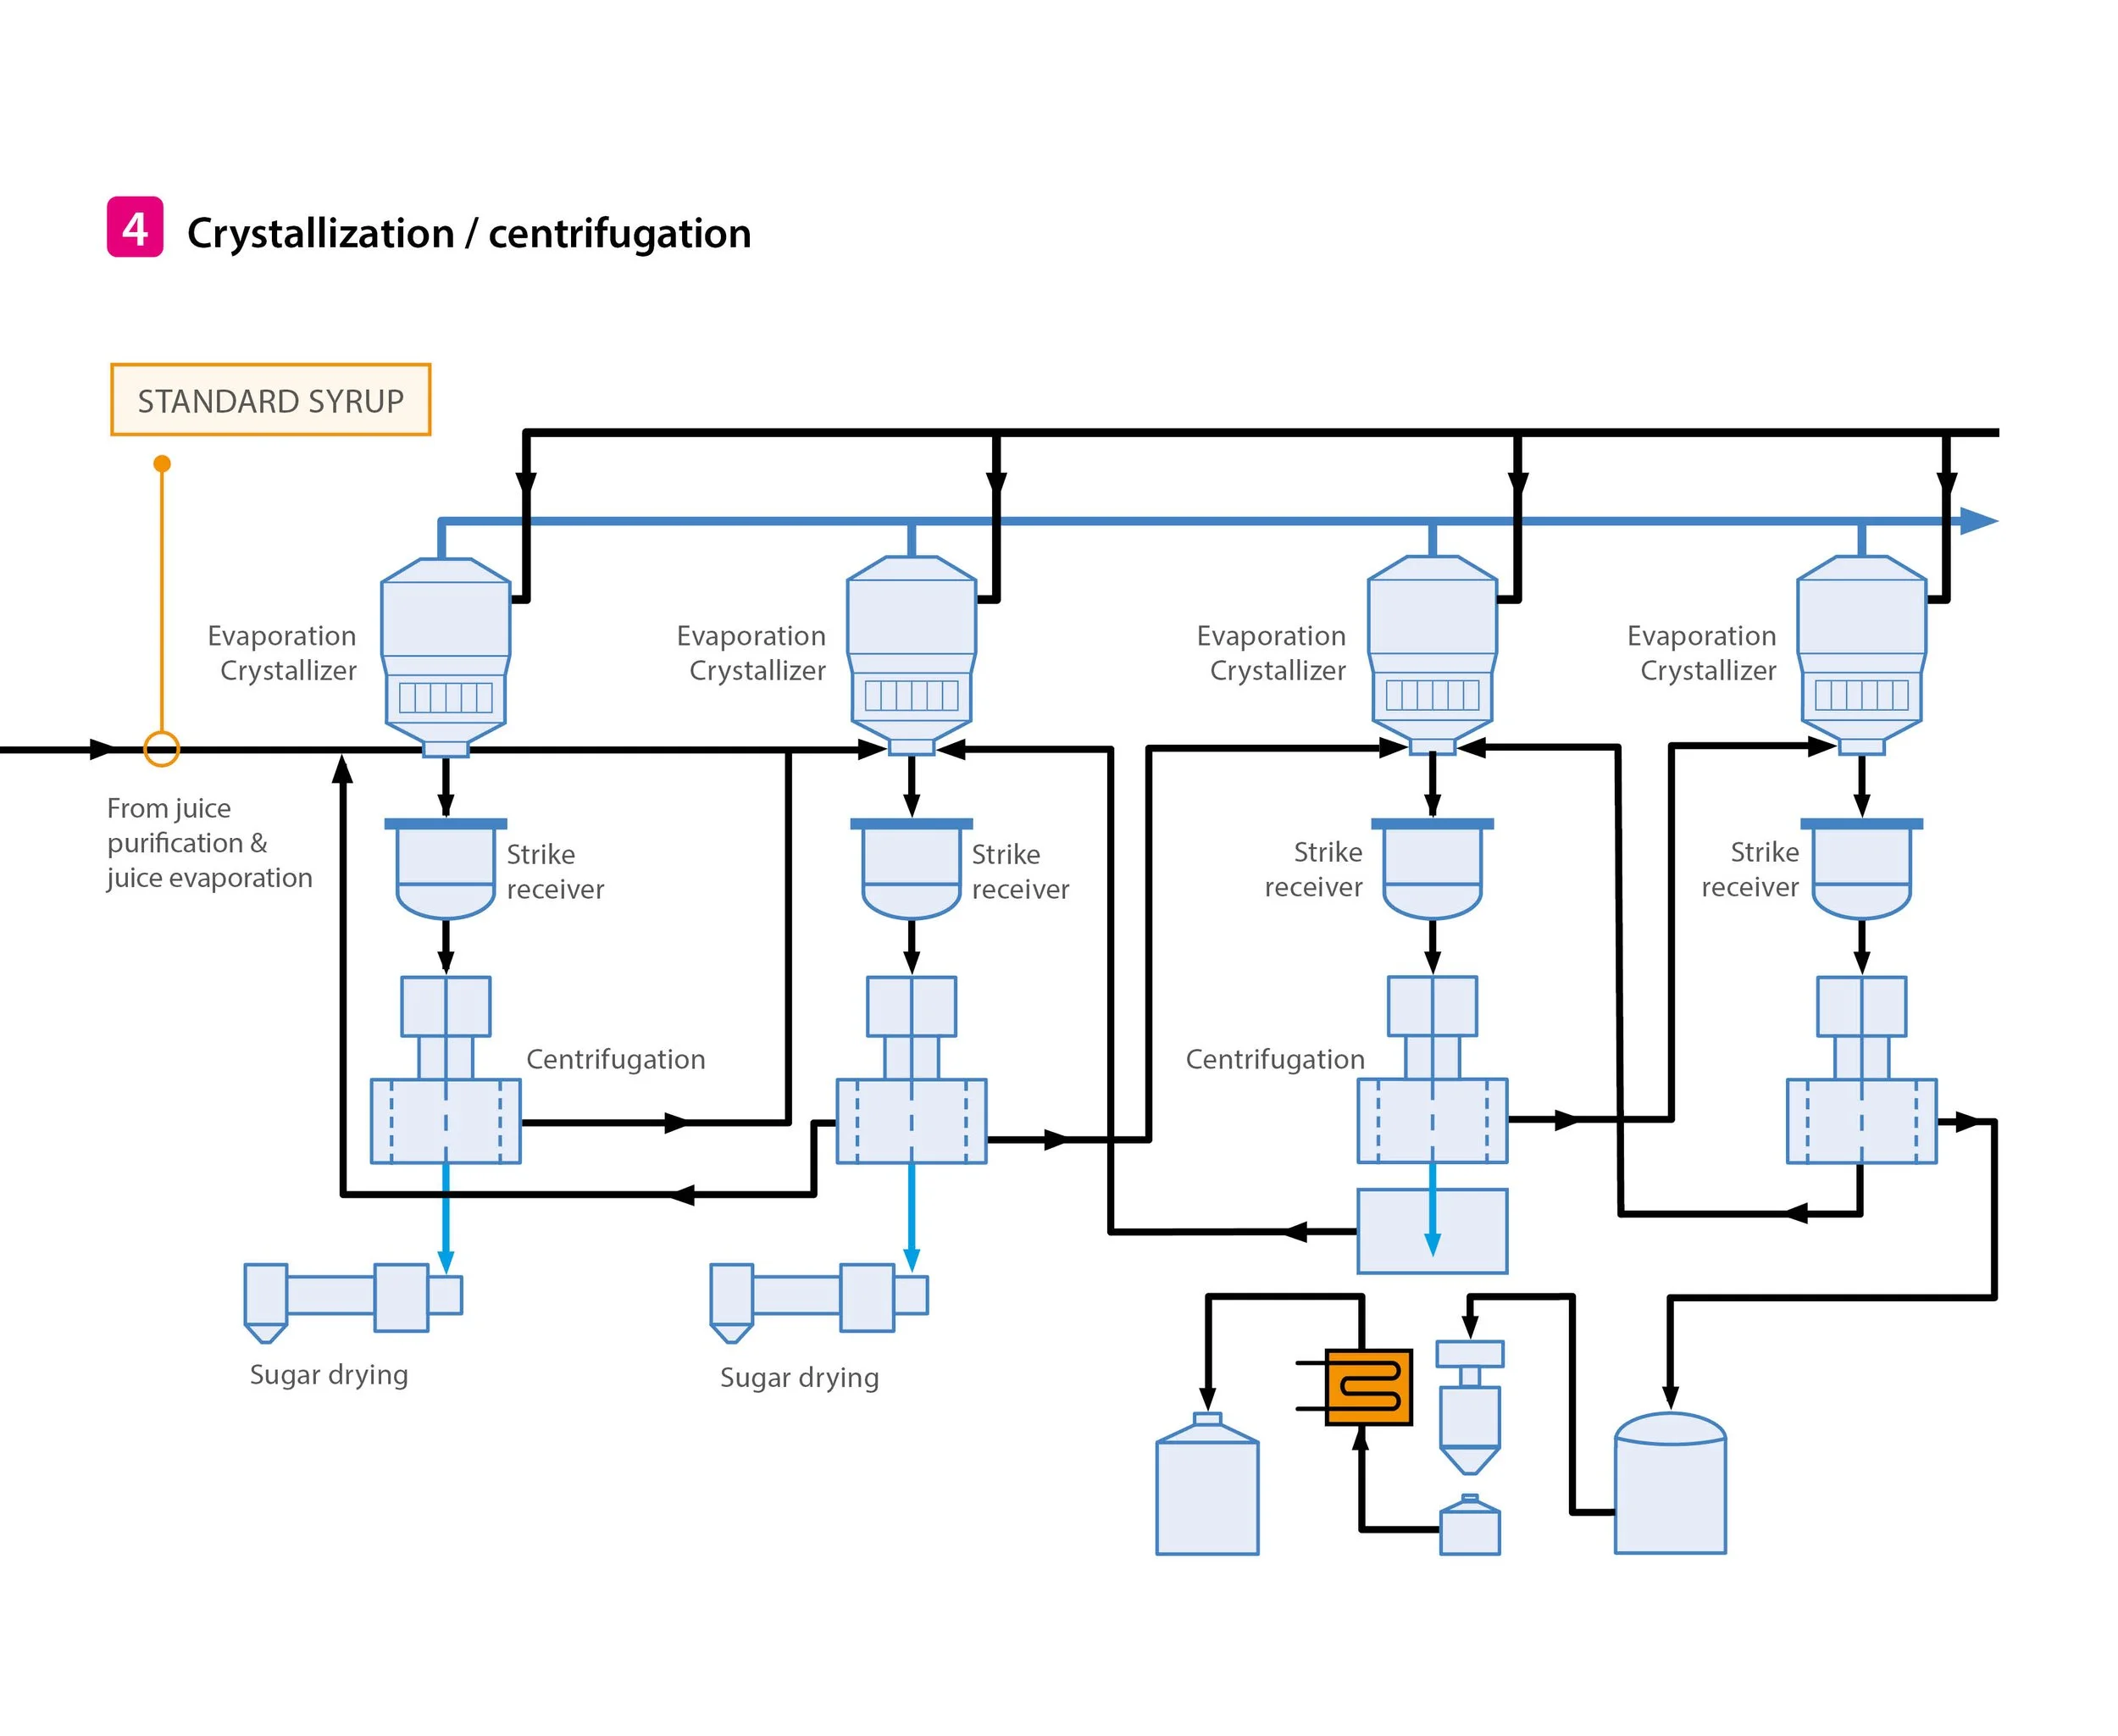
From measurement values to process decisions
Earlier detection of process deviations
Continuous trends help operators see quality changes before they become major process problems.
Better purification control
Color and turbidity trends can help evaluate clarification and purification performance in near real time.
More stable evaporation and crystallization
Continuous Brix and quality trends support stable feed conditions for downstream process areas.
Reduced dependence on manual sampling
Inline monitoring does not replace laboratory analysis, but it provides continuous visibility between lab samples.
Better reporting and troubleshooting
Logged measurement data helps process engineers analyze deviations, compare shifts and identify recurring issues.
Foundation for process intelligence
Juice quality data can become part of broader sugar factory analytics, remote diagnostics and optimization services.
Measurement technologies used
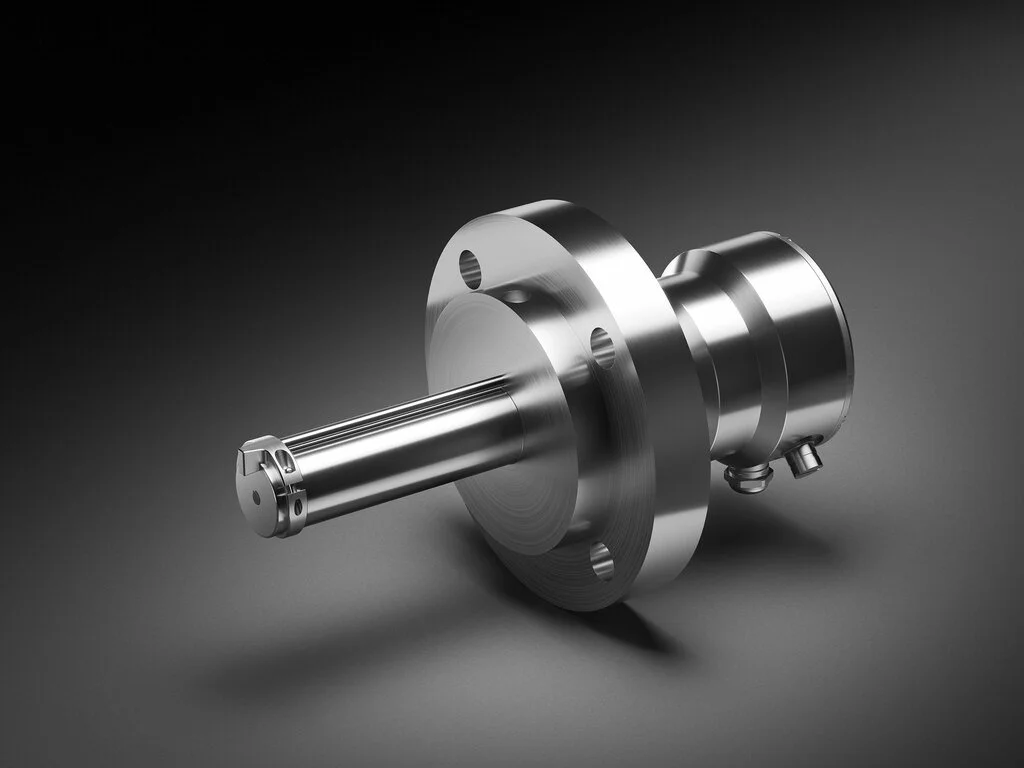
Refractometry for Brix
Process refractometers are used for inline concentration measurement in juice and syrup streams.
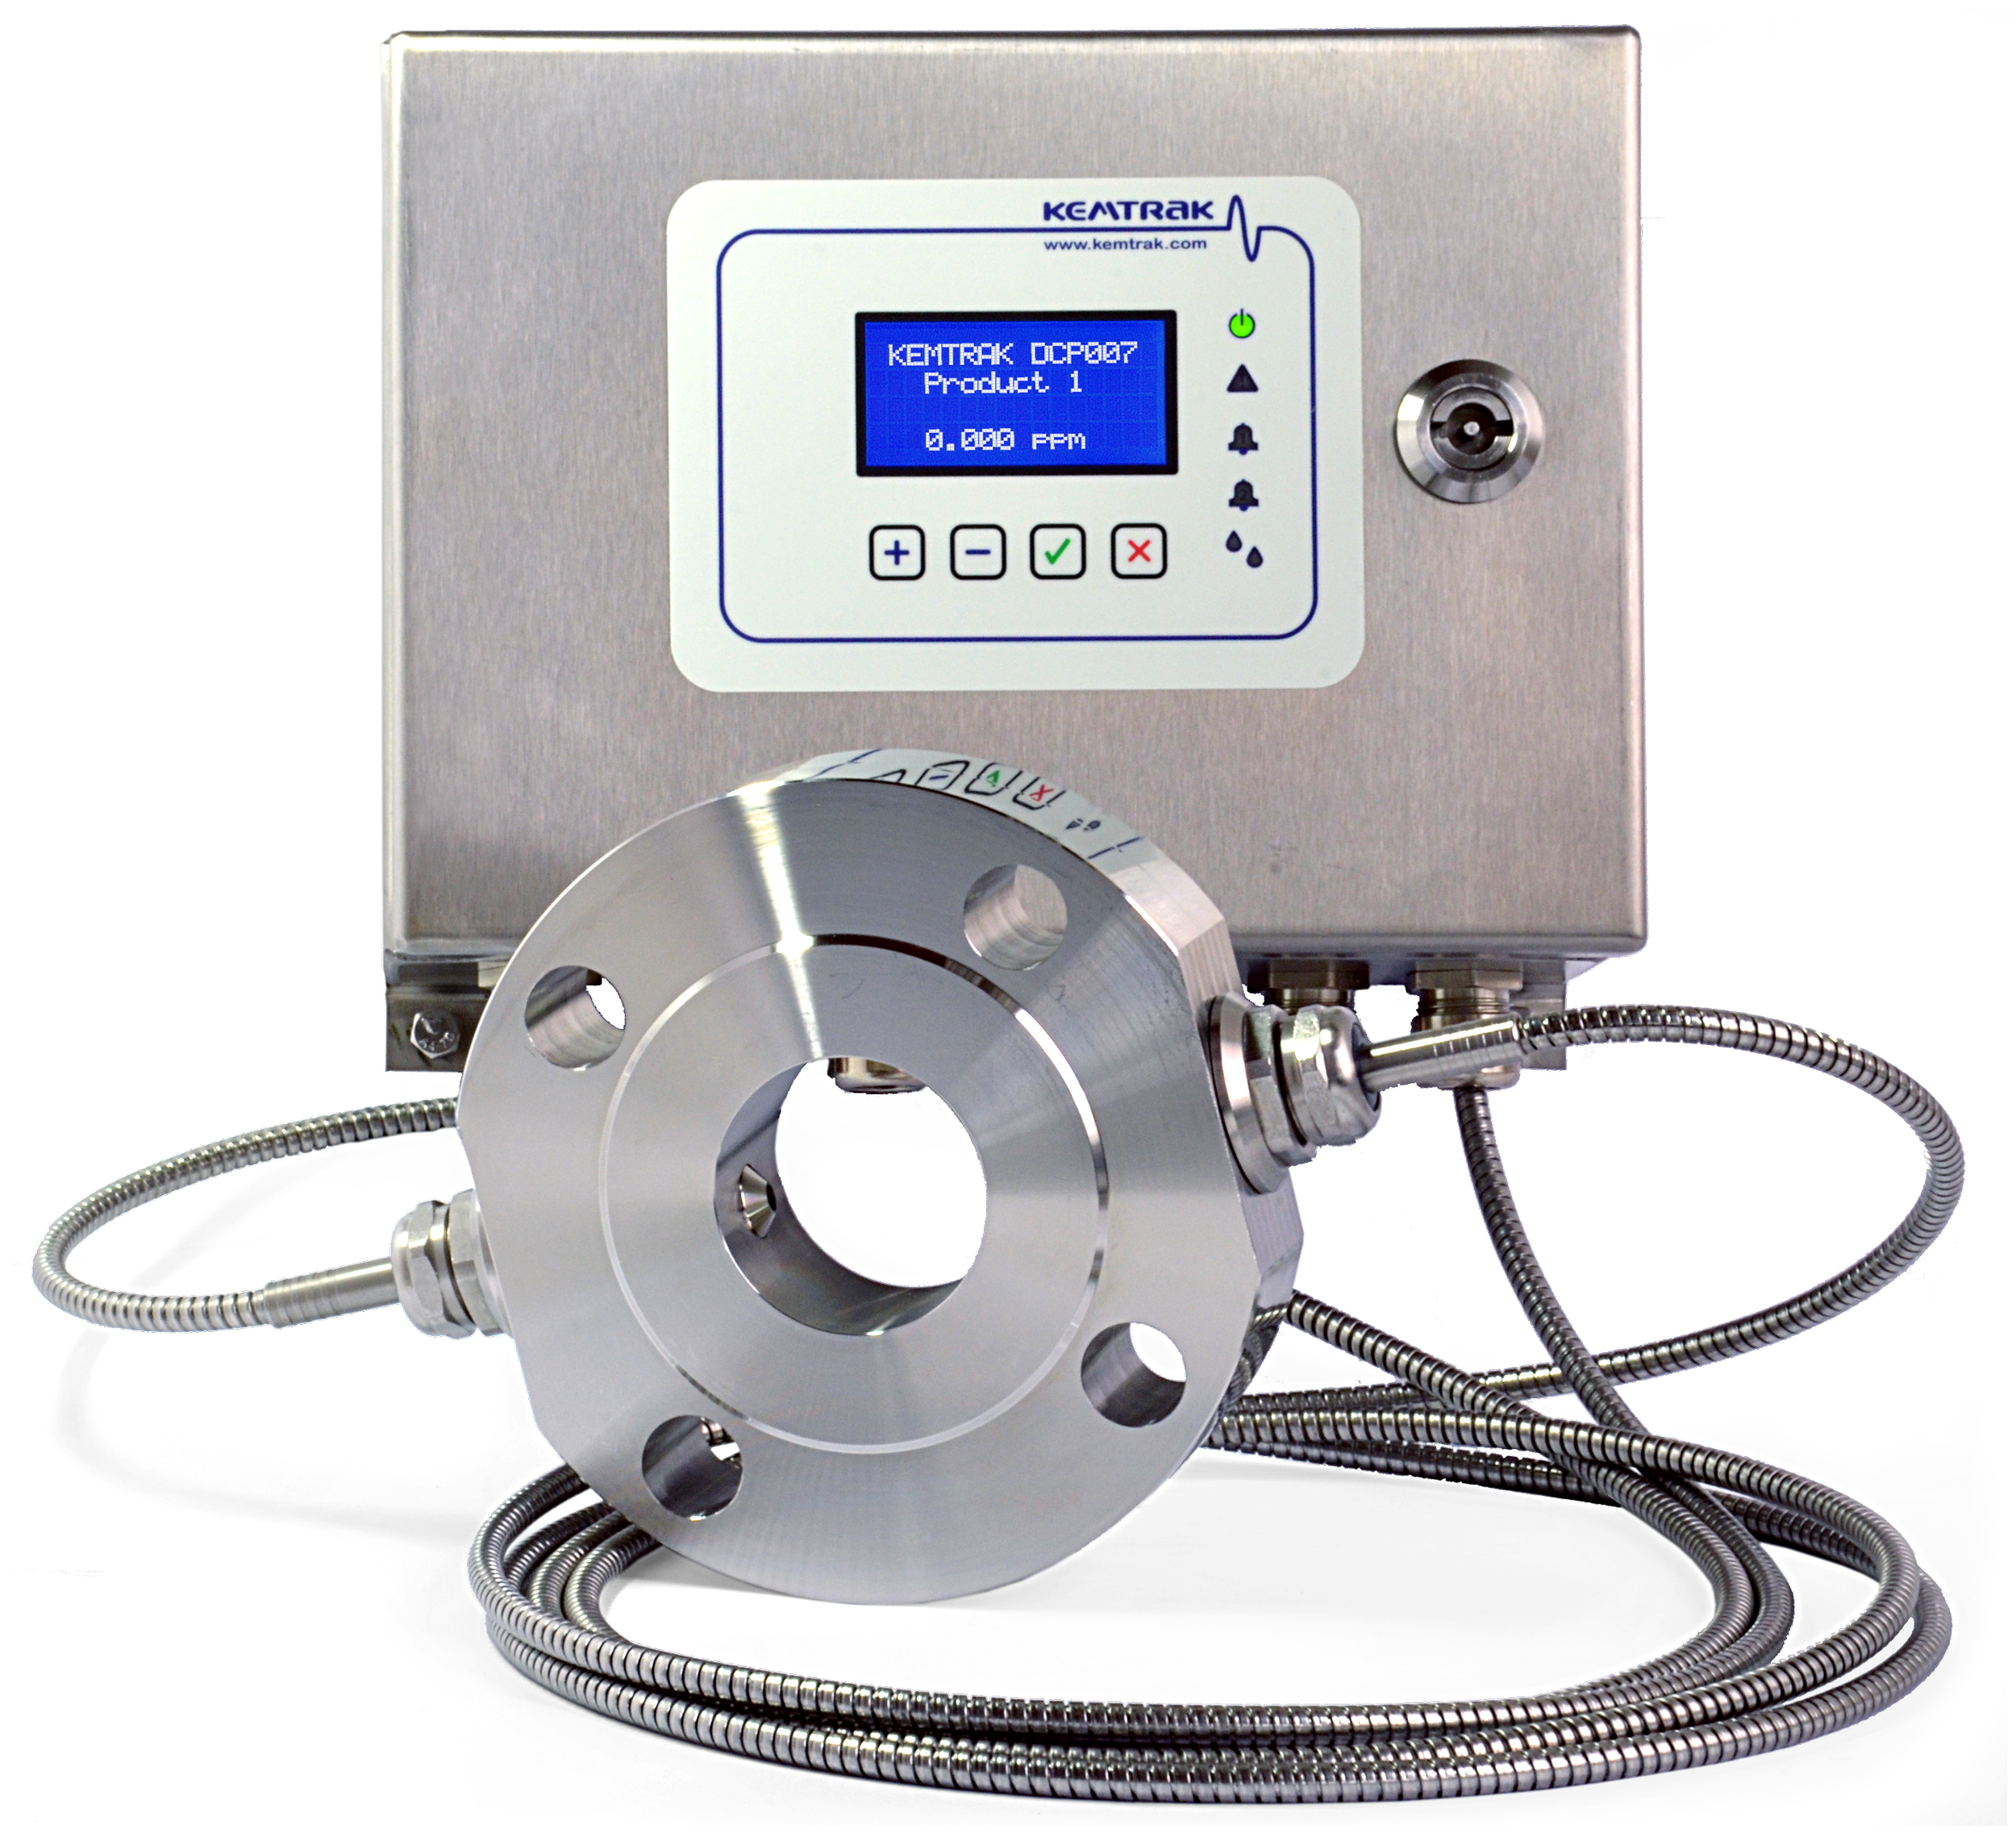
Photometry for color and turbidity
Process photometers can measure optical absorption, color or turbidity at selected wavelengths, depending on the application and required correlation.
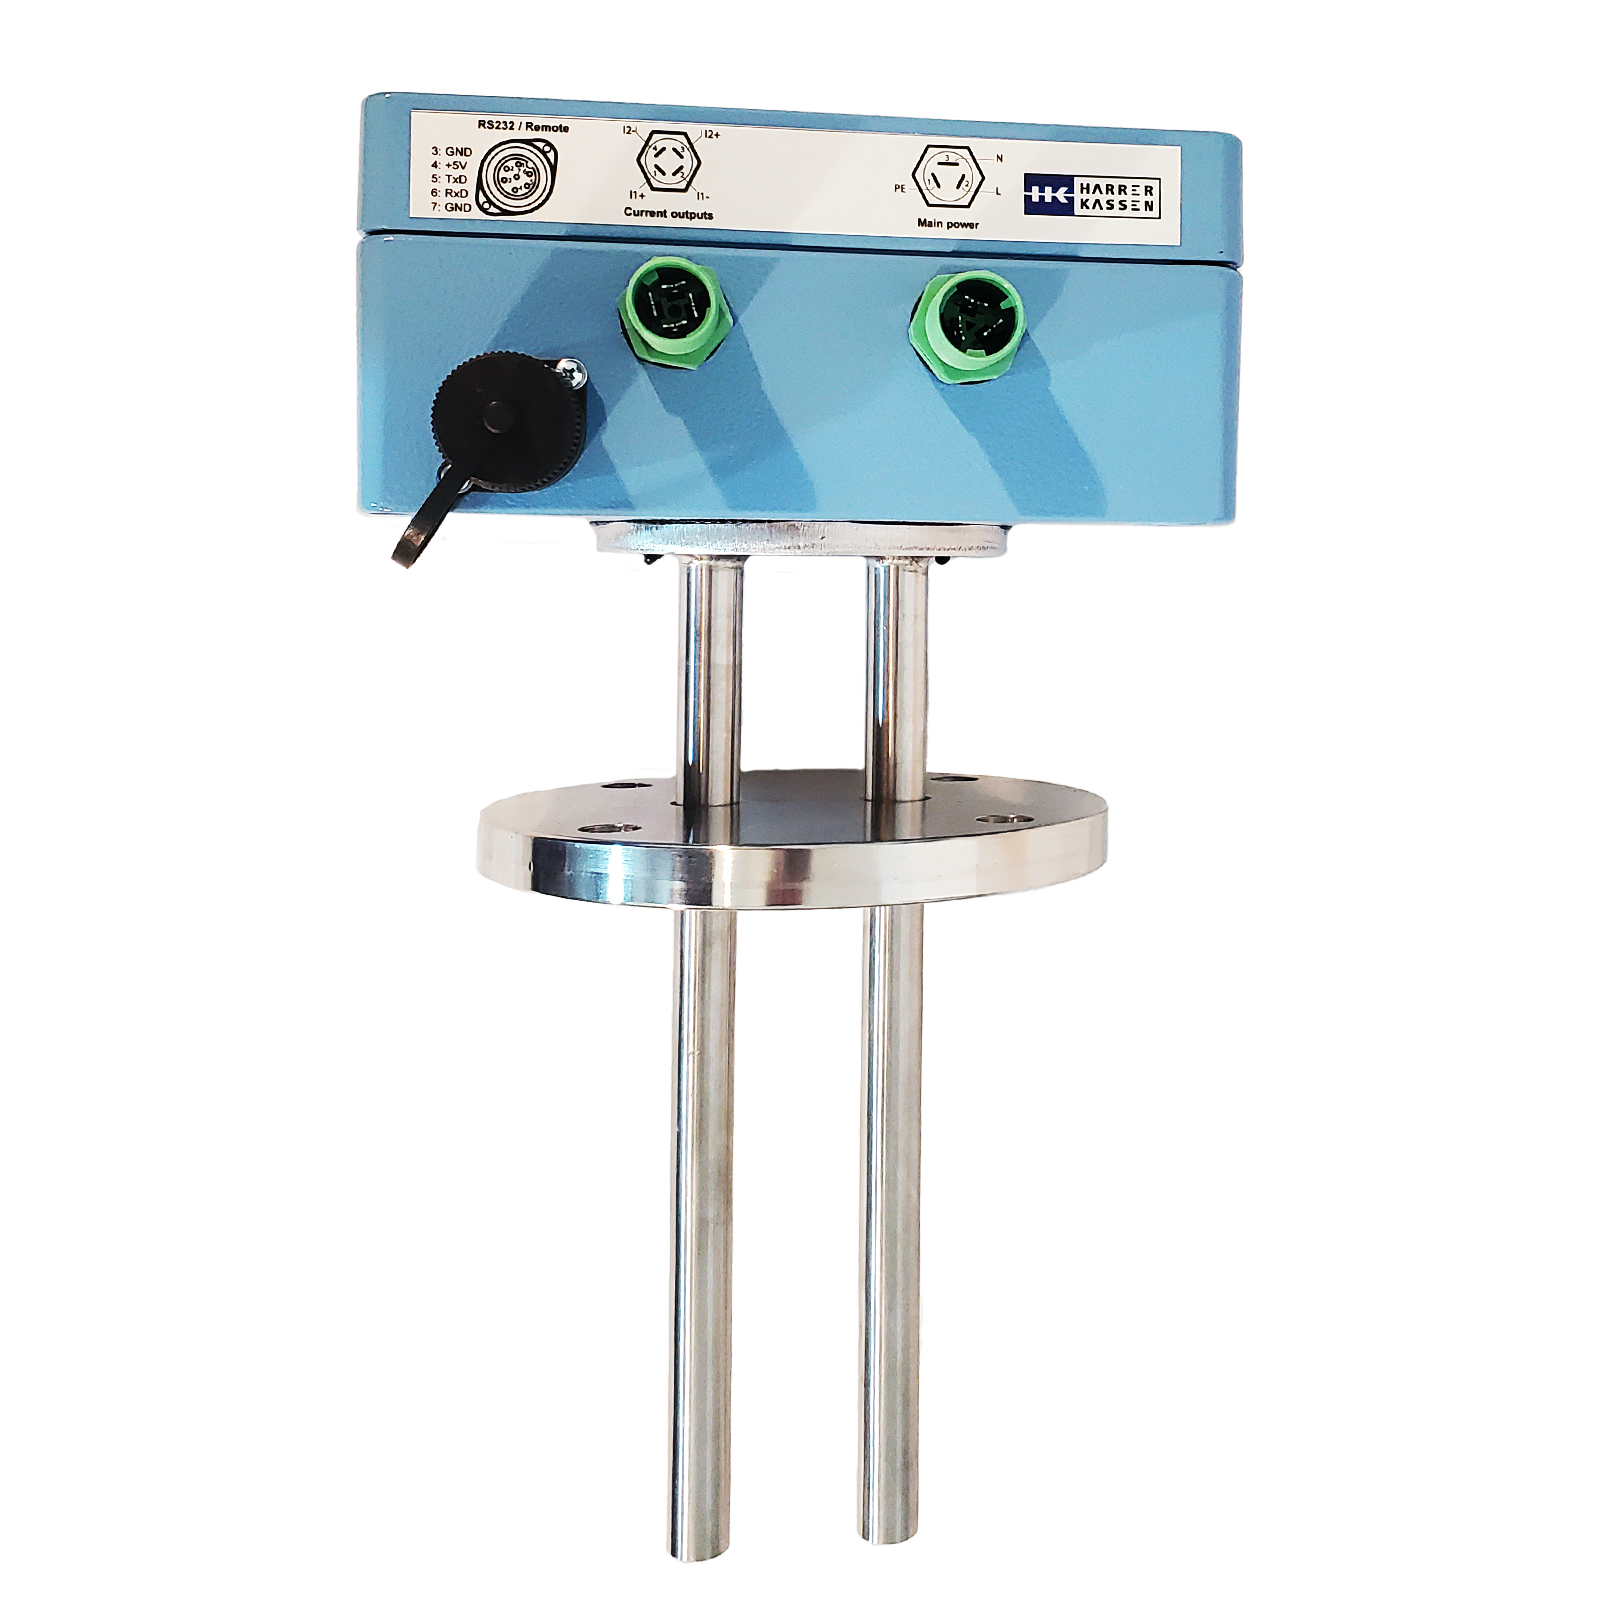
Microwave solids measurement where relevant
Microwave sensors can be used in applications where total solids or dry substance measurement is required and refractometry alone is not sufficient.
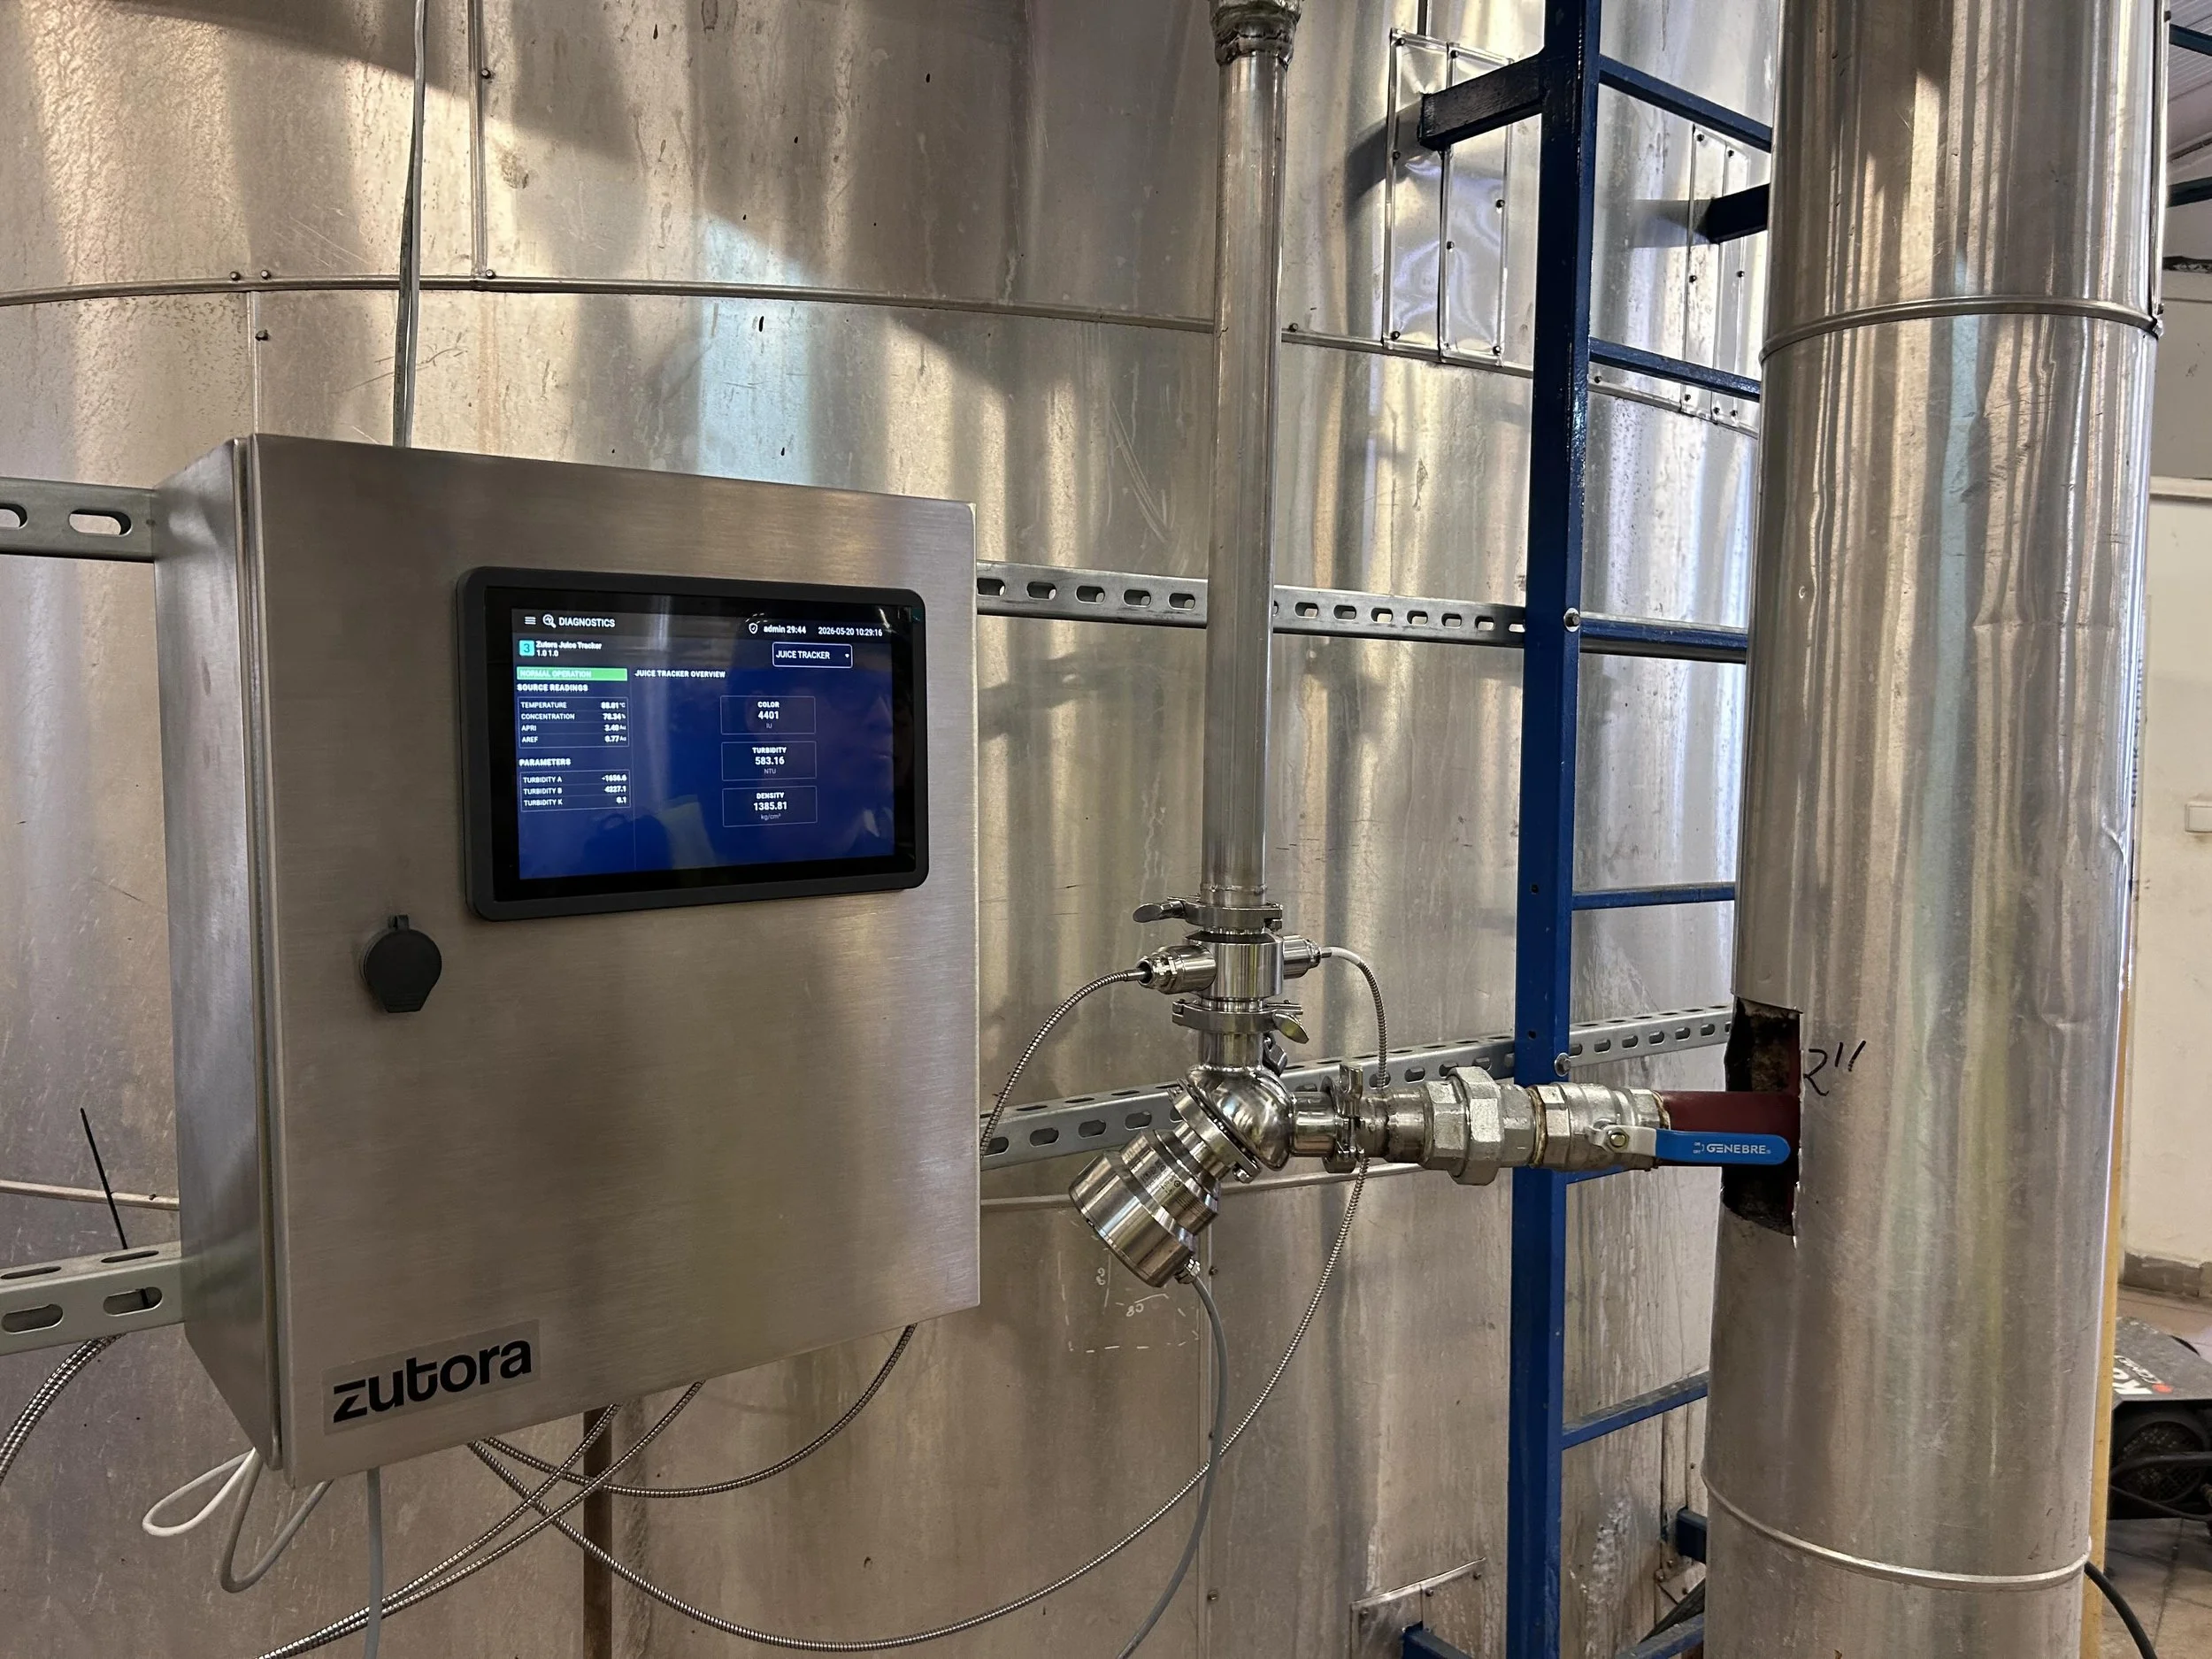
MT-1 / JuiceTracker platform
Zutora can combine multiple analyzers into one interface for trends, diagnostics, data logging and export.
More than individual sensors
Individual analyzers can provide valuable measurements, but the real value comes from combining them into a process-specific monitoring system.
JuiceTracker connects measurement values, compensation, trends, alarms and data export into one sugar-focused solution. This helps operators and process engineers see not only individual numbers, but meaningful quality trends.
| Individual instruments | JuiceTracker solution |
|---|---|
| Separate measurement values | Combined quality overview |
| Local display only | Centralized trends and logging |
| Raw measurement values | Compensated and interpreted process values |
| Limited process context | Sugar-specific quality monitoring |
| Manual comparison of values | Easier process analysis and reporting |
| Separate sensor diagnostics | Integrated diagnostics and system overview |
Part of a wider sugar process intelligence concept
Juice quality monitoring can also become part of a broader sugar factory data and optimization concept. When combined with crystallization data, evaporation performance and process KPIs, juice quality trends can help explain downstream behavior and support long-term process improvement.
Zutora can use JuiceTracker data as part of remote diagnostics, performance monitoring and sugar industry intelligence services.
Frequently Asked Questions
-
Sugar juice quality monitoring is the continuous measurement of key process values such as Brix, color, turbidity and temperature in sugar juice streams. It helps operators follow quality changes between laboratory samples and detect process trends earlier.
Zutora’s JuiceTracker solution combines these inline measurements into one practical monitoring system for sugar factories.
-
Typical inline parameters include Brix or concentration, color, turbidity, optical absorption and temperature. Depending on the application, additional calculated or compensated values can also be used.
Zutora helps select and integrate the right combination of refractometers, photometers and other sensors for each measurement point.
-
No. Laboratory analysis remains important for reference, calibration and quality control. Inline monitoring provides continuous visibility between laboratory samples and helps operators react faster to changing process conditions.
Zutora designs inline systems to complement laboratory data, not replace it.
-
Typical measurement points include raw juice, clarified juice, clear/thin juice, thick juice, syrup and crystallization feed streams. The best locations depend on the factory layout and the process questions you want to answer.
Zutora can help evaluate suitable measurement points based on the factory’s process and control objectives.
-
Inline color measurement helps factories monitor purification performance, detect process changes earlier and understand how juice quality may affect evaporation, crystallization and final product quality.
Zutora can combine inline color measurement with Brix, turbidity and temperature trends to create a more complete juice quality picture.
-
A single measurement rarely describes juice quality completely. Brix shows concentration, color indicates dissolved color-forming components, and turbidity can indicate suspended solids or clarification-related issues.
JuiceTracker combines these values into continuous trends, alarms and quality indicators for sugar factory operation.
-
JuiceTracker is Zutora’s inline sugar juice quality monitoring solution. It combines process analyzers, application-specific calculations, trends, alarms and data export to help sugar factories monitor juice quality continuously.
-
Yes. Juice quality affects evaporation, syrup quality and crystallization behavior. Continuous Brix, color and turbidity trends can help explain downstream changes and support better interpretation of pan performance.
Zutora can connect juice quality monitoring with broader sugar process intelligence and crystallization control concepts such as SeedMaster.