
Zutora Sugar360
Turning factory data into action
Every sugar factory collects thousands of process values every second. Yet when production drops, a pan boils too long, or steam consumption increases, finding the real cause often takes hours—or never happens at all.
Sugar360 continuously watches your factory, connects production data across the pan floor, and highlights where capacity, energy, quality or process stability are being lost.
Step 1 – Collect
Connect every important signal.
pans
tanks
receivers
sensors
PLC/DCS
SeedMaster
JuiceTracker
Step 2 – Understand
Turn data into information.
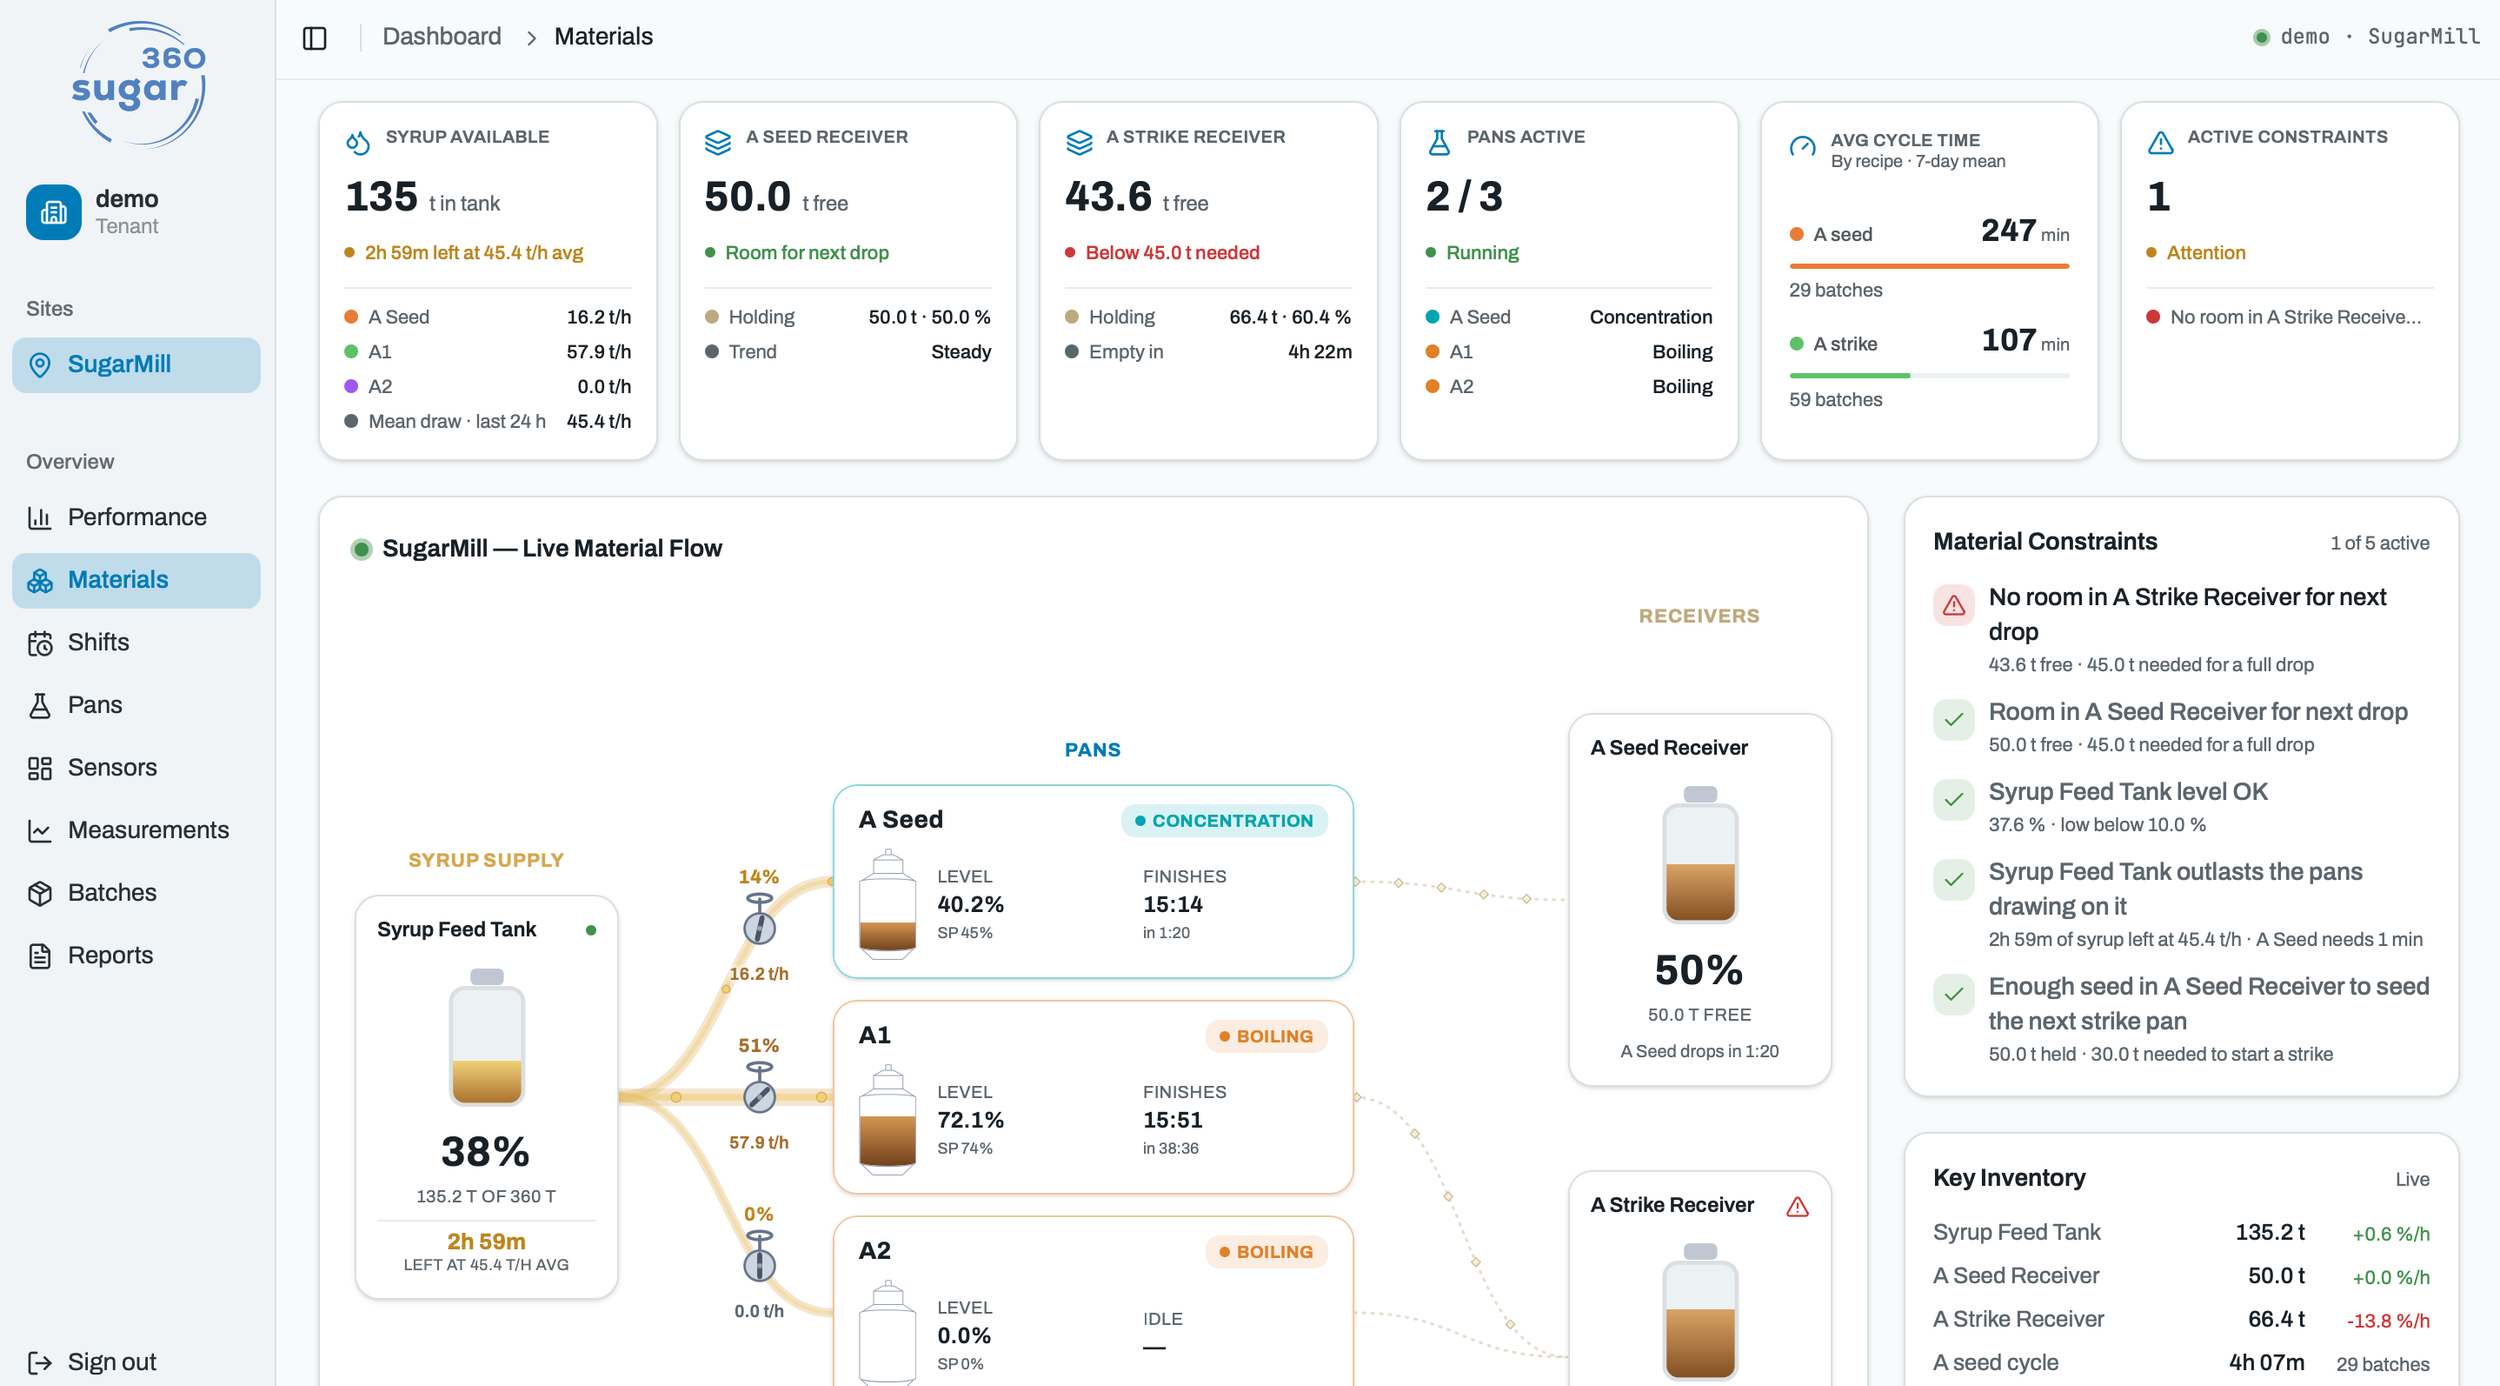
dashboards
trends
material flow
KPIs
batch history
Step 3 – Improve
Find opportunities automatically.
bottlenecks
abnormal batches
steam losses
waiting time
sensor problems
operator variation
Step 4 – Grow
Continuous optimization.
weekly reports
benchmarking
remote experts
monthly reviews
future predictive analytics
How it works
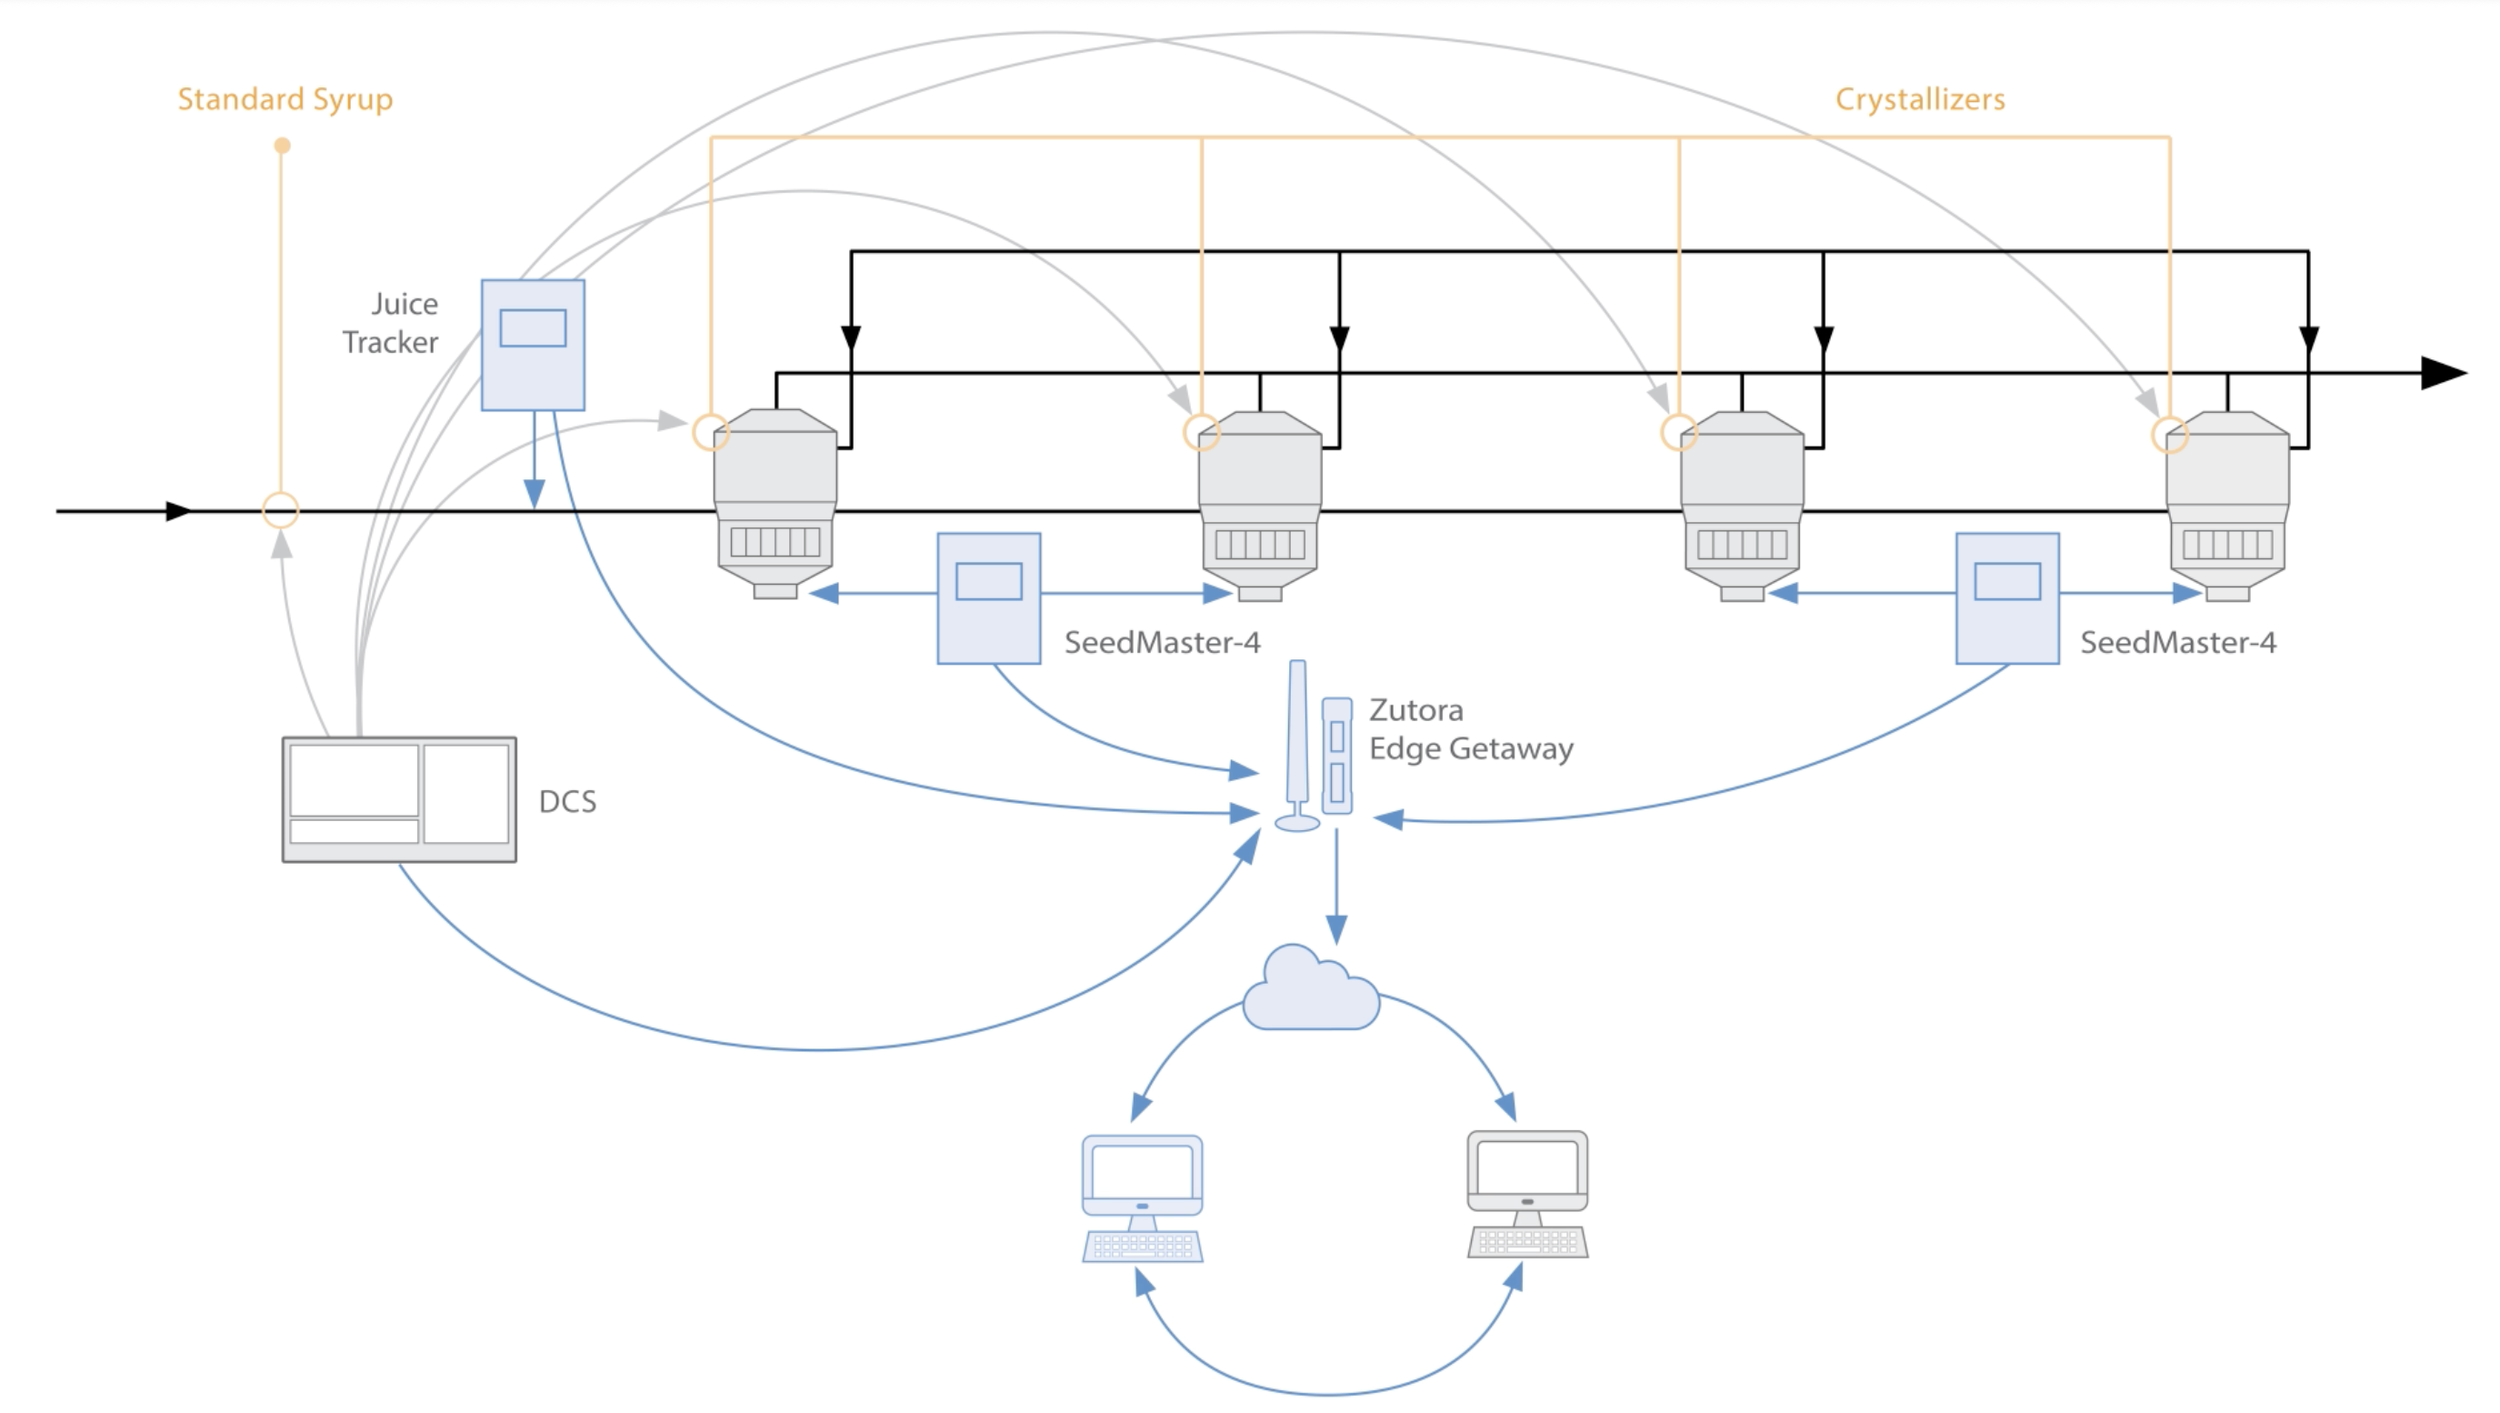
Zutora installs an industrial edge gateway at the factory. The gateway can collect real-time measured and calculated data from:
PLCs, SCADA systems and customer process data sources
Batch information, process values, diagnostics, alarms and calculated indicators
SeedMaster crystallization control systems
JuiceTracker sugar juice quality monitoring systems
Refractometers, microwave sensors, photometers and other analyzers
The gateway continuously collects and buffers all data locally. If the internet connection is temporarily unavailable, no data is lost: the gateway stores the missing records and sends them automatically to the Zutora cloud once the connection is restored.
On Zutora servers, the data is stored, processed, visualized and interpreted. Authorized customer users can access dashboards, trends, statistics and reports from anywhere.
What makes it valuable
Most factories already have SCADA trends. Zutora Sugar360 understands sugar factories.
Which crystallizers are performing best — and which are underperforming?
Which batches were abnormal, unstable or unusually long?
Did supersaturation control behave as expected?
Are operators, shifts or pans producing different results?
Is juice quality changing in a way that may affect the process?
Are sensors drifting, failing or giving suspicious values?
Which deviations need attention before they become expensive problems?
Instead of only showing data, the system helps turn production history into decisions.
Continuous red-flag monitoring
Zutora automatically watches for a wide range of possible process, quality and measurement problems, including:
Crystallizer instability
Unusual supersaturation behavior
Increasing batch time
Poor repeatability between batches
Differences between crystallizers
Sensor drift, signal loss or abnormal diagnostics
Juice color, Brix or turbidity deviations
Missing data or communication problems
Process values outside the expected operating window
The goal is simple: detect problems earlier, reduce unexplained variation, and support better process decisions.
Benchmark crystallizers against each other
When multiple crystallizers are connected, Zutora can compare their real production performance.
This helps identify:
Best-performing pans
Underperforming crystallizers
Differences in batch time and control stability
Effects of process settings and operator practices
Opportunities for standardization and optimization
For factory managers and technologists, this creates a clear picture of where performance is being gained — and where it is being lost.
Reports, alerts and expert support
Zutora can generate daily or weekly reports summarizing the most important process and quality indicators.
Reports may include:
Crystallizer performance ranking
Batch-to-batch comparison
Abnormal batch list
Juice quality trends
Sensor and system health checks
Important deviations and red flags
Recommended follow-up actions
For advanced service levels, Zutora experts can review the data together with the customer in regular online meetings and provide practical recommendations for process improvement.
This gives factories access to specialized sugar-process expertise without waiting for an on-site visit.
Why Zutora Sugar360
Better crystallizer performance
Use real production data to identify unstable batches, underperforming pans and improvement opportunities.
Earlier warnings
Detect process, quality or sensor problems before they cause larger losses.
Less operator and batch variation
Compare batches, shifts and crystallizers using consistent data.
Useful management reports
Turn raw process data into clear daily or weekly summaries.
Reliable data history
Local buffering protects against lost records during internet outages.
Remote expert supervision
Zutora sugar specialists can help interpret the data and support continuous improvement.
From process data to sugar-process intelligence
Zutora Sugar360 is not a generic cloud dashboard.
It combines industrial data collection, secure cloud storage, sugar-specific analytics, automatic reports, crystallizer benchmarking and expert process support.
Know what is happening. Understand why it is happening. Improve what happens next.
Zutora — sugar-process intelligence built on real factory data.